Market Overview: NASDAQ 100 Emini Futures
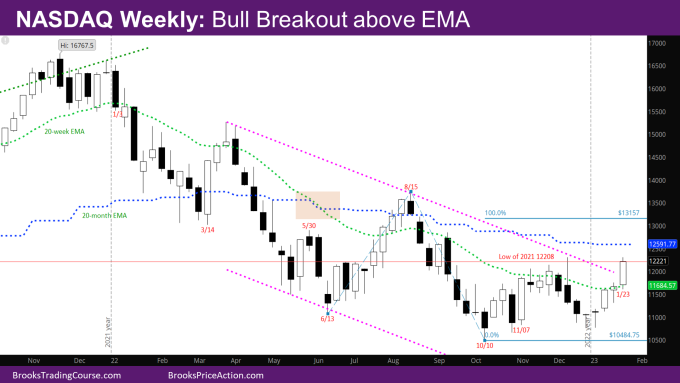
The NASDAQ Emini futures market in breakout above weekly EMA (exponential moving average) and is back at the December high.
The January monthly bar so far is a good bull reversal bar. A couple of problems for bulls: It is an inside bar (i.e. high and low within the December bar). It has lot of overlap with the December month bear bar, and big in size to be a good reversal bar.
Given there are two trading days left in the month, the month will end up an even bigger bar if bulls continue to buy. If it sells off, the month ends with a tail on top. Either way, the upside is likely limited to the targets mentioned below, and the sideways move will have to continue till the bulls produce a better reversal bar on the monthly chart.
NASDAQ 100 Emini futures
The Weekly NASDAQ chart

- This week’s candlestick is a bull trend bar with small tails closing far above the weekly EMA.
- Bulls need a strong follow-through bar next week to confirm the breakout.
- Bulls had produced a pair of bull bars back in 4/6/2020 and 4/13/2020 which went far above both the weekly and monthly EMAs.
- This time, the monthly EMA is above and will likely act as resistance.
- Another possible target is the Leg1/Leg2 move at 13157 where Leg 1 is the move up from June to August and Leg 2 is the move up from October.
- The bulls have a 4-bar bull micro channel (low of bar higher than prior bar low), so there should be another leg up.
- The bears would like a double top with the December high, but given the strong reversal up in January, the bears will likely need a wedge bear flag to the targets above – between the monthly EMA and 13157 and then get a leg down.
- Since bulls did not have a good signal bar in January, this is still likely a minor reversal, and bulls will need a good signal bar around the level of the bar from the week of 1/2.
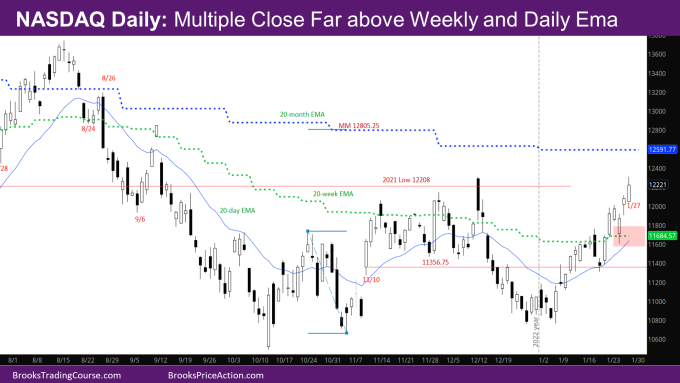
The Daily NASDAQ chart

- Friday’s NQ candlestick is a bull trend bar with a tail at the top.
- Friday went above the big bear bar from 12/13 and then sold off to produce the tail at the top.
- Last Friday was a big bull bar closing just above the weekly EMA. Bulls needed a similar sized bull follow-through bar Monday to increase the odds of a breakout above the weekly EMA.
- Bulls got the follow-through bar Monday closing far above the weekly EMA.
- Every bar this week was a bull bar, even though 3 days in the week gapped down or sold off on the open.
- The market is far above the daily and weekly EMA for the first time since July, and the daily EMA looks ready to cross-over the weekly EMA.
- Given the monthly EMA is still far away, the market will have to go sideways between the daily and monthly EMA till the monthly EMA comes close enough to the weekly and daily EMA (like back in mid-August) for the market to go above all of them.
- Bulls would still like to make the Measured Move (MM) target at 12805.25 of the Inverse Head and Shoulder (IVH) shown in the chart.
- This is a reasonable target since it’s around the monthly EMA.
- It is also around the high of the bull spike back in early September that reversed into a bear trend which means there are trapped bulls over there.
- Bears would still like a second leg corresponding to the leg down in December.
- Given the strength of the reversal up in January, the bears will likely need a wedge bear flag around the targets mentioned above.
Market analysis reports archive
You can access all weekend reports on the Market Analysis page.

