Market Overview: NASDAQ 100 Emini Futures
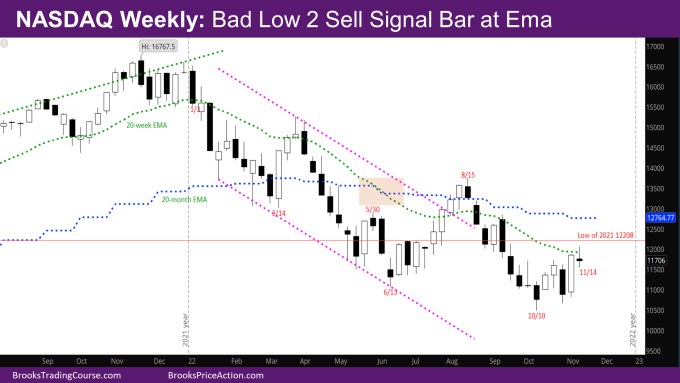
The NASDAQ Emini futures market is pausing at the weekly exponential moving average (EMA) with a bad Low 2 sell signal bar.
Last week’s report said that there will likely be sellers at the weekly EMA and depending on the quality of the sell signal could determine whether there will be sellers below. The sell signal bar is weak, which likely means more buyers than sellers, and sellers will wait to sell higher, or the bears need to create a micro double top next week.
NASDAQ 100 Emini futures
The Weekly NASDAQ chart

- This week’s candlestick is a bear doji Low 2 sell signal bar at the weekly EMA.
- This week was disappointing to both bulls and bears.
- Bulls would have liked a strong follow-through bull bar to last week.
- Bears would have liked a strong sell signal bar at the EMA.
- As mentioned above, big bars closing just near the EMA usually attract sellers.
- At this point, bears have tried selling thrice and the market has reversed two of those times – They sold the week of 10/24 that created the tail below, and then the week of 10/31, and last week reversed it.
- The bears tried selling again this week, but not strong. Will the bulls be able to reverse?
- One problem for the bulls again is that the signal bar from the week of 10/10 is a bear bar like back in June.
- The market is in a trading range – What we don’t know is where is the top of the range – somewhere between the weekly and monthly EMA.
- This is still likely a minor reversal from the October low and bulls will need a good entry bar in the next month or two around the bar from the week of 10/10.
- As mentioned before, the low of last year at 12208 will be a magnet for the rest of the year. The bulls want to close the year above the low of last year, while the bears want a close far below the low.
- Given how strong a bull bar last year was, it’s more likely this year will close around 12208 or above than far below it.
The Daily NASDAQ chart

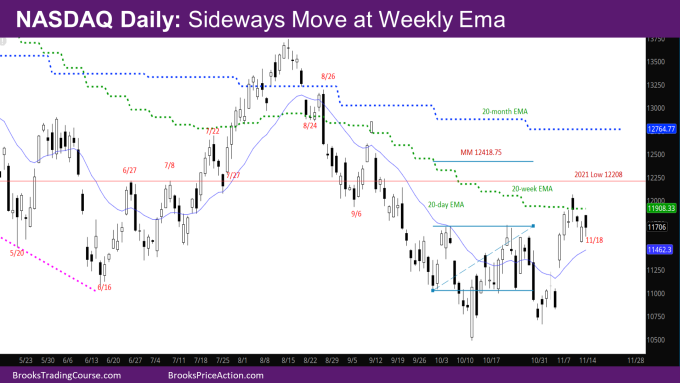
- Friday’s NQ candlestick is a bear bar with a tail below
- This week was essentially sideways as described by the doji bar on the weekly chart.
- The bulls needed to create a good bull bar early in the week as a follow-through to the pair of good bull bars on Thursday and Friday last week, but that did not happen.
- As mentioned last week, the market may have to go more sideways/down and create more consecutive bull bars in this reversal from the October low (compared to the reversal from June low) before a credible breakout above inverse head and shoulder (IVH) shown in the chart.
Market analysis reports archive
You can access all weekend reports on the Market Analysis page.

