Market Overview: NASDAQ 100 Emini Futures
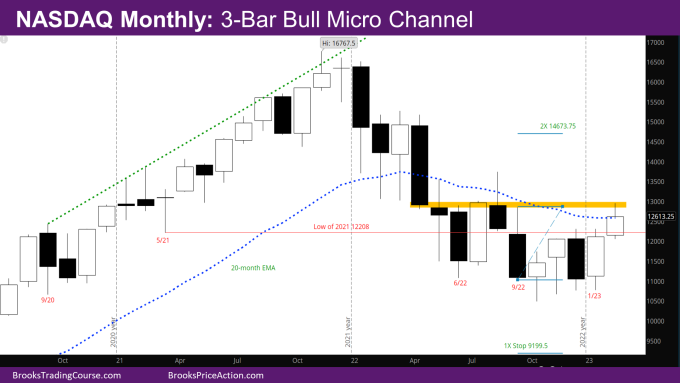
The January monthly NASDAQ Emini futures is a bull trend bar with small tails above and below. The January month created a 3-bar bull micro channel – the low of each bar higher than the low of prior bar going back to October.
The body overlaps the body of the December bar – it essentially reverses the December bear bar.
Last month’s report mentioned that the market may go below the December low to see where buyers come in. That did not happen, so the year so far is an inside bar.
Given big sideways bars near the monthly exponential moving average (EMA) for the past 3 months, the market is likely to go more sideways – the upside and downside is limited.
NASDAQ 100 Emini futures
The Monthly NASDAQ chart

- This month’s candlestick is a bull trend bar with small tails above and below.
- The bull micro channel makes it likely that there will be a 2nd leg up. This is similar to when there was a bear micro channel in June on the way down, there was a small second leg down in August and September.
- Last month’s report had outlined some bear and bull targets in the near term. Since the market is in a bull micro channel now, the bull targets will be more interesting for the next few months.
- Possible bull targets:
- The monthly EMA around 12584. The market already went above this level this week.
- If a bull bought the low of September, given multiple failures to break below, with a stop 1X size of September bar below at 9199.5. Assuming a 40% chance their stop does not get hit, they would want to make 2X the risk, which would put the target at 14673.75. That is a 40% chance, market goes to 14673.75 before it goes to 9199.5.
- Note that the market has already reached 1X target by going above the September bar.
- Given the market is back at the monthly EMA for the first time since August, the February month close will determine the course for next few months.
- If the market closes far above the monthly EMA, the upside target mentioned above will become more probable.
- If the market closes with a significant tail above, the market may do the opposite of what happened May-September last year.
- The market is also back in the area where there has been very little body overlap since the big bear bar in April 2022 – the bars after April have little body overlapping with the body of April (shown by the yellow area on the chart). That has been a sign of strength on the part of bears. Will that change in the next few months?
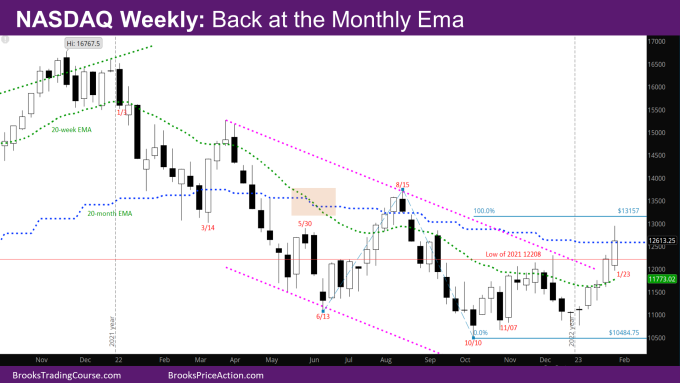
The Weekly NASDAQ chart

- This week’s candlestick is a big bull trend bar with a big tail at the top closing right at the monthly EMA.
- Bulls needed a strong follow-through bar this week to confirm the breakout last week above the weekly EMA.
- They got the strong follow-through bar, although as expected the market is at the monthly EMA and pulled back producing a big tail on top.
- The positive for the bulls is that the bodies of the two weekly bars are proportional.
- There will likely be a pullback soon for at least a week.
- The bulls have a 5-bar bull micro channel (low of bar higher than prior bar low), so there should be another leg up.
- One possible target is the Leg1/Leg2 target at 13157 where Leg 1 is the move up from June to August and Leg 2 is the move up from October.
- Another target is the close of Week of 8/8 at 13569.75 – the last bull bar of the micro channel up in August. That was a reasonable buy the close bar, and there are trapped bulls up there.
- The bears will likely need a wedge bear flag to around the targets above and then get a couple of legs down.
- Since bulls did not have a good signal bar in January, this is still likely a minor reversal, and bulls will need a good signal bar around the level of the bar from the week of 1/2.
Market analysis reports archive
You can access all weekend reports on the Market Analysis page.

