Market Overview: NASDAQ 100 Emini Futures
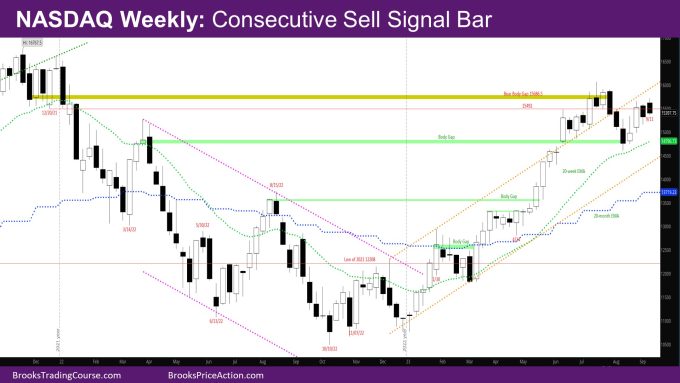
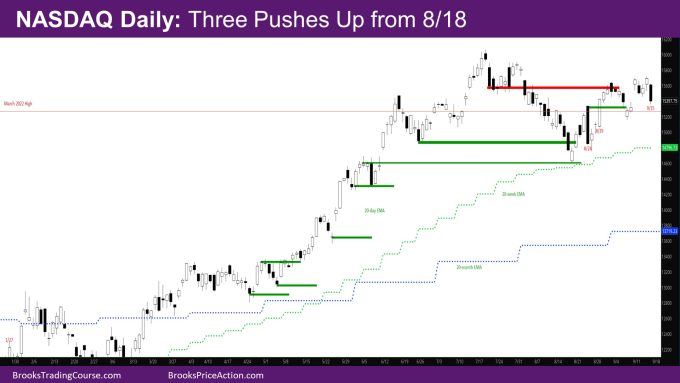
The NASDAQ Emini futures week is a consecutive sell signal bar with its low above last week’s low. On the daily chart, this week looks like the 2nd and 3rd push of three pushes up from 8/18. The market tried breaking out above last week’s high and reversed.
The 2nd leg down for the move down from 7/31 is still in play.
NASDAQ 100 Emini futures
The Weekly NASDAQ chart

- The week is a good-looking bear reversal bar just above last week’s high.
- The week gapped up above last week’s high and tried breaking above it.
- However, by the end of the week, the bar had become a bear bar closing near its now.
- So, the question is – Is this a better sell signal bar than last week? While the bar is a stronger bar than last week and has small tails, it is higher in price than last week and has quite a bit of overlap with last week’s body.
- What that means is that it is not likely to result in a bear breakout, and more so a bar or two with tails below, and buyers below last week’s low.
- Buyers will likely come in below the low of week of 8/28 which was a strong bull bar.
- There is also the outstanding test of the exponential moving average (EMA)
- Bears wanted to close the body gap with March 2022, which they did couple of weeks ago, although with only a small overlap.
- If bulls can go up from here, the body gap close would be a considered a negative gap – a small overlap, but trend resumption up.
The Daily NASDAQ chart

- Friday is a big bear trend bar resting on the daily EMA.
- The daily chart looks like a wedge – 3 pushes up. The 2nd and 3rd pushes have bad sell signal bars so likely more sideways and nested wedges till there is a better sell signal bar.
- Monday had a big surprise gap up above last week’s high and far above the daily EMA.
- It was a chance for the bulls to trap the bears by breaking out above last week’s high.
- Tuesday gapped near Monday’s low and closed on its low. It also closed the breakout gap over last week close/high.
- Wednesday was a good bull reversal bar and Thursday a follow-through bar and the market was back near the high of the week.
- Friday gapped down again and sold off relentlessly to create the biggest bear bar since 8/24.
- Given big bars like this usually don’t have follow-through, Monday is likely a bull reversal bar around Friday’s low, or for Monday to gap up and be an inside bar.
- The week would have been a strong bull bar if the week had closed on Thursday. It is interesting that Friday reversed the entire bullishness of the week.
- 8/29 was a strong bull bar. There should be buyers below that bar if the market gets there.
Market analysis reports archive
You can access all weekend reports on the Market Analysis page.


I’m curious why my NASDAQ (NQ) chart is not the same as yours? The candles are not the same.
Hello Miles, My charts are the day session charts. Is yours globex by any chance?