Market Overview: NASDAQ 100 Emini Futures
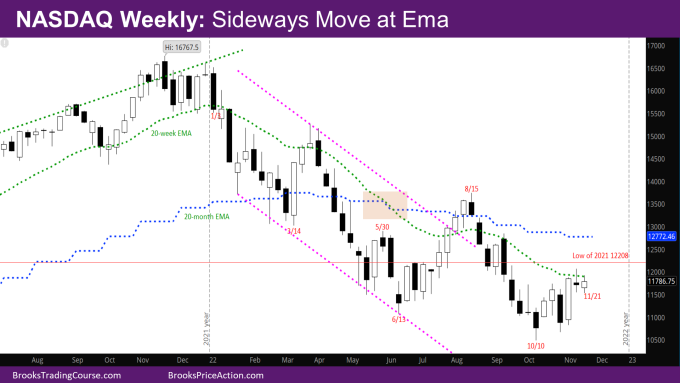
The NASDAQ Emini futures market is pausing, a Nasdaq 100 sideways move at the weekly exponential moving average (EMA). This week is a bad entry bar to the weak sell signal bar last week.
Given the weak signal bar last week, it was likely that this week would not be a big bear bar. The bears could have created a micro double top this week but did not.
Next week is the last week of the month. The bulls would like to create a strong entry bar to last month’s reversal bar on the monthly chart. So, they would like to gap up Monday, and create 3 consecutive good bull trend bars to end the month. The open of the month, and the high of last month at 11595.25 and 11734 respectively will be magnets for the early part of next week.
NASDAQ 100 Emini futures
The Weekly NASDAQ chart

- This week’s candlestick is a small bull bar at the weekly EMA with tails at the top and bottom.
- If the bears could have created a better sell signal bar this week – a micro double top with last week, there was a better chance of a bear leg down.
- The bears will likely have to wait to sell higher.
- One problem for the bulls again is that the signal bar from the week of 10/10 is a bear bar like back in June.
- The market is in a trading range. What we don’t know is where is the top of the range – somewhere between the weekly and monthly EMA.
- This is still likely a minor reversal from the October low and bulls will need a good entry bar in the next month or two around the bar from the week of 10/10.
- As mentioned before, the low of last year at 12208 will be a magnet for the rest of the year. The bulls want to close the year above the low of last year, while the bears want a close far below the low.
- Given how strong a bull bar last year was, it’s more likely this year will close around 12208 or above than far below it.
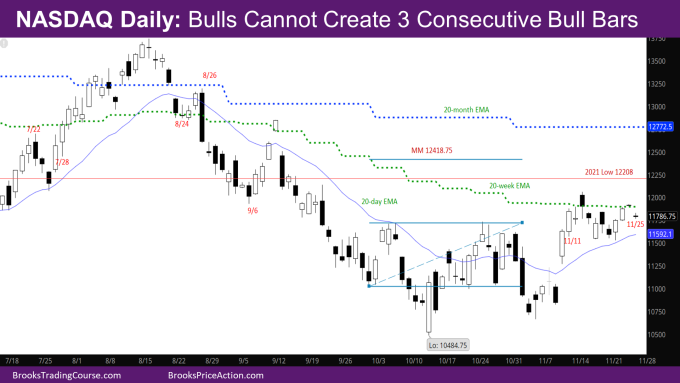
The Daily NASDAQ chart

- Friday’s NQ candlestick is a small doji bear bar.
- Thursday and Friday were both reduced holiday trading hours.
- Monday was a bear bar, that was reversed on Tuesday and Wednesday with good bull trend bars ending at the weekly EMA.
- However, Thursday and Friday were bad follow-through bars.
- The market has been going sideways at the weekly EMA for the past two weeks.
- In this reversal since October, the bulls have not created three consecutive bull trend bars with good closes. The market has exhibited more trading range price action – sell big bull bars, buy big bear bars with wide stops.
- For example, look at 11/11 and 11/23 which were both cases of consecutive bull bars at the weekly EMA. A third good bull bar closing above the weekly EMA would have likely led to higher prices.
- Compare that to 7/28 which was another instance of a 2nd consecutive good bull trend bar at the weekly EMA. 7/29 was a good follow-though bull bar closing above the weekly EMA. It then led to higher prices.
- By that time, the market had also been trending (previous leg had three consecutive bull trend bars closing above prior highs).
- For the reasons above, the market now may have to go more sideways/down and create more consecutive bull bars before a credible breakout above the weekly EMA.
- Can the market gap up on Monday above the weekly EMA and create 3 good-looking consecutive bull trend bars? As explained above, the bulls could possibly do that to make the month end on a strong note.
Market analysis reports archive
You can access all weekend reports on the Market Analysis page.

