Market Overview: NASDAQ 100 Emini Futures
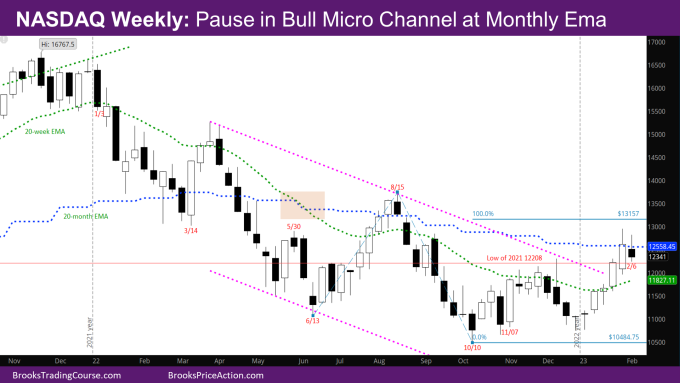
NASDAQ 100 pause on weekly Nasdaq 100 Emini futures chart at the monthly exponential moving average (EMA) after 4 weeks of bull bars.
This week was an opportunity for the bulls to break strongly above the monthly EMA, although given the strong move up for the last two weeks, a pullback was likely soon.
NASDAQ 100 Emini futures
The Weekly NASDAQ chart

- This week’s candlestick is a bear reversal bar with a big tail at the top and a small top at the bottom right at the monthly EMA.
- This week is an inside bar to last week and is hence an implied pullback.
- Given that there is a 5-bar bull micro channel (low of bar higher than prior bar low), there should be another leg up. Hence there should be buyers below this week.
- One possible bull target is the Leg1/Leg2 target at 13157 where Leg 1 is the move up from June to August and Leg 2 is the move up from October.
- Another target is the close of Week of 8/8 at 13569.75 – the last bull bar of the microchannel up in August. That was a reasonable buy the close bar, and there are trapped bulls up there.
- The bears will likely need a wedge bear flag to the targets above and then get a couple of legs down.
- Since bulls did not have a good signal bar, this is still likely a minor reversal, and bulls will need a good signal bar around the bar from the week of 1/2.
The Daily NASDAQ chart

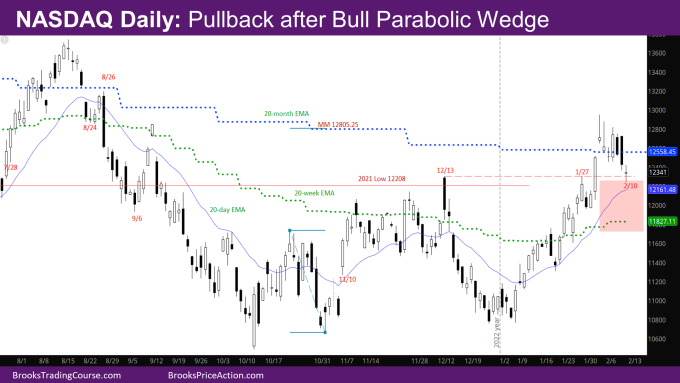
- Friday’s NQ candlestick is a doji bar with a big tail at the top and bottom.
- Summary of last week price action:
- The market broke above a possible double top at the big bear bar from 12/13 and the bar from 1/27.
- It then reached the measured move (MM) target at 12805.25 of the Inverse Head and Shoulder (IVH) shown in the chart for the past several month reports.
- The market crossed far above the monthly EMA.
- The market also reached the high of the bull spike back in early September allowing the trapped bulls there to exit.
- The market made a Parabolic Wedge (PW) in reaching these targets, thus making two legs sideways to down more likely.
- The bulls exiting and bears selling there is likely what started the pullback last week, when last week ended with daily bars with big tails at the top.
- This week there was a bull day Tuesday, but bear days Wednesday and Thursday and Friday ended with a retest of the breakout point.
- The question now is whether the breakout test will be successful or will there be a deeper pullback?
- Given the monthly EMA is still far away from the weekly EMA and daily EMA, the market will have to go sideways between the monthly and weekly EMA till the monthly EMA comes close enough to the weekly and daily EMA (like back in mid-August) for the market to go above all of them.
- The daily EMA is back above the weekly EMA for the first time since August.
Market analysis reports archive
You can access all weekend reports on the Market Analysis page.

