Market Overview: NASDAQ 100 Emini Futures
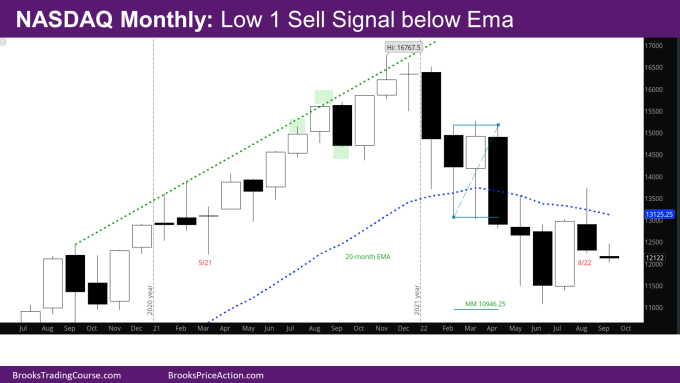
NASDAQ Emini futures monthly candlestick is bear bar closing on its low with a tail on top. It is a NASDAQ 100 low 1 sell signal bar below the exponential moving average (EMA).
Last month’s report had made a case for the market to go at least slightly higher to targets above – monthly EMA, high of May. The market made these targets and reversed. The report had also made a case for sideways market given the big bars with overlap in the months of June and July. Now that the market has reversed, the market will likely be more sideways for the next few months.
NASDAQ 100 Emini futures
The Monthly NASDAQ chart

- This month’s candlestick is a NASDAQ 100 Low 1 sell signal reversal bear trend bar.
- The market went above the EMA, but the monthly EMA acted as resistance.
- The case for sideways/tight trading range for next few months –
- The June, and July bars are big – In a trading range, big bars attract sellers at the top and buyers at the bottom.
- The signal bar – the month of June is a bear bar, so bulls will likely need a second entry with a good bull signal bar.
- The market likely will not go down much below July – July is a big bull bar, so buyers below and the market went sufficiently above July, so buyers somewhere below August.
- The bears would like a double top (DT) bear flag with May high, with the neckline around July low, and a measured move (MM) down.
- Minimally, they would like to make their target at the MM down of the February-March double bottom (DB) on monthly chart with target at 10946.25. This is right around the low of the November 2020.
- The market came to within 70 points of this target in June. This is still a viable target unless the bulls create consecutive bull trend bars for the next 2-3 months.
- The best path for the bulls is to get a good second entry long after a few sideways bars.
The Weekly NASDAQ chart

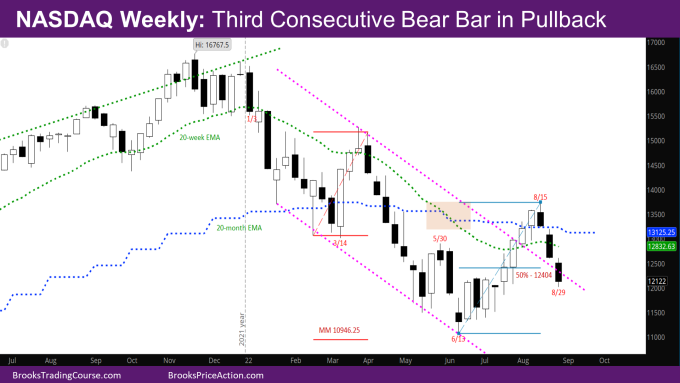
- This week’s NQ candlestick is a bear trend bar with small tails at the top and bottom.
- This week was important in deciding the shape of the monthly bar.
- All of the below are signs of strength for the bears:
- It is the third consecutive strong bear bar, and the second consecutive bear bar below the EMA.
- There are no overlapping bodies over the past 3 bars.
- The last two bars are uniformly sized – one is not much bigger than the other.
- The market is at an interesting place:
- Its around a 50% pullback of the move up from June.
- It’s retesting the bear trendline that it broke out above.
- The market had a strong move up from June, so there should be a second leg up after this pullback. At the same time, the pullback is strong enough that it should have its own second leg first.
- As mentioned in previous reports, one of the problems for the bulls has been that the signal bar from 6/13 is a bear bar, and the market should come back to at least test that signal bar.
Market analysis reports archive
You can access all weekend reports on the Market Analysis page.

