Market Overview: NASDAQ 100 Emini Futures
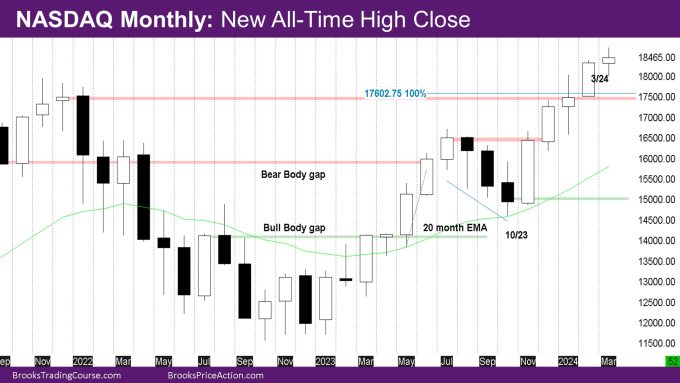
The NASDAQ Emini futures March monthly candlestick is a bull doji bar with tails. It is a new all-time high close, with a close above the February month high.
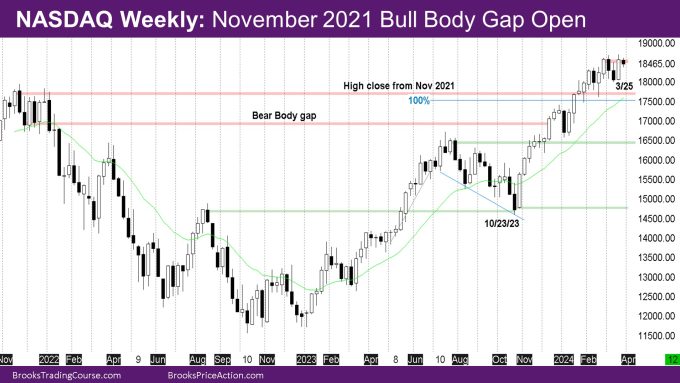
The week is a small bear inside bar. Bulls had a chance to breakout or produce a non-climactic bull bar but failed instead.
NASDAQ 100 Emini futures
The Monthly NASDAQ chart

- The March month bar is a doji bull bar with tails.
- Bulls needed a good follow-through bar to the good bull bar of last month.
- Bulls did the minimum – a bull close above last month’s high, but with tails.
- This is another month in the bull micro-channel that started in November – where the low of the bar is above the low of the prior bar.
- This means first reversal is minor and likely buyers below.
- Wrt the December 2021 close, there are now two bull closes above it. Is that enough to consider a successful bull body gap with December 2021 close?
- This month’s bar being a doji bar still makes it possible that bears can close the gap, but they need to avoid a bull trend bar in April.
- Bulls need the opposite – They need a bull trend bar in April to make it more likely that the bull gap with December 2021 remains open.
The Weekly NASDAQ chart

- The week is a small bear inside bar.
- This was a short trading week with Friday being a trading holiday.
- Bulls needed a strong follow-through to the bull bar of last week. They did not get it.
- This is a second entry short after the bear bar from 3 weeks back.
- The market also hasn’t closed above the high close from 4 weeks ago (now shown with a red resistance line)
- Bears want to prevent a higher close than 4 weeks ago.
- Bears want to continue the sideways move of the past month in the hopes that bulls give up.
- Next week should trigger the sell signal bar of this week.
Market analysis reports archive
You can access all weekend reports on the Market Analysis page.

