Market Overview: NASDAQ 100 Emini Futures
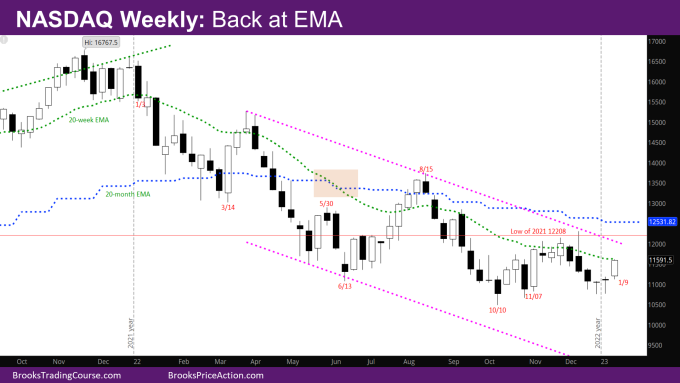
The NASDAQ Emini futures market continues to be in a trading range and is back at weekly EMA exponential moving average (EMA).
The market was at the bottom of the trading range from November for the past couple of weeks and appears to be making a bull leg of the trading range. The question is how high will the bull leg be?
NASDAQ 100 Emini futures
The Weekly NASDAQ chart

- This week’s candlestick is bull trend bar with very small tails closing just below the weekly EMA.
- We are in the same situation as in the past – a good bull trend bar breaking above bad signal bars and closing right at the EMA.
- This is an opportunity both for bears and bulls.
- Bears were likely waiting to sell at the EMA.
- Bulls have an opportunity to trap the bears by producing a strong bull bar next week that closes far above the EMA.
- It’s more likely that the market will need to go more sideways to down and form a triangle.
- Bulls can then produce a good signal bar around the bar from the week of 10/10.
The Daily NASDAQ chart

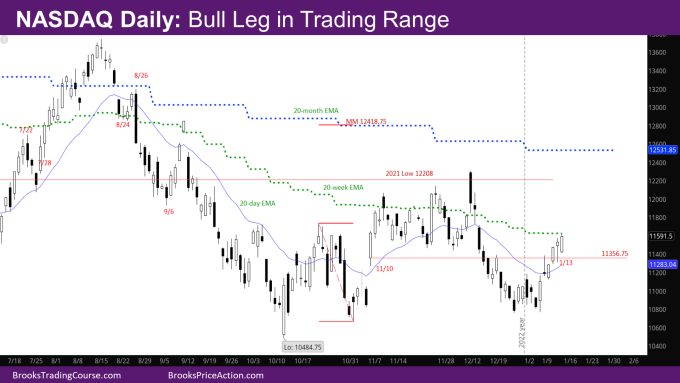
- Friday’s NQ candlestick is a bull trend bar with very small tails.
- This is the first week in a while where bulls bought in a controlled manner – three of the days in the week are bull trend bars good sized bars relative to each other, and not exhaustive.
- However, this strength is coming in the 2nd leg up and would have been better in the first leg up last week.
- The market reached the high of the gap 11/9-11/10 at 11356.75 on Monday and reversed down. This was a scalp down for bears.
- The bulls reversed the market on Tuesday and Wednesday with good bull trend bars and reached the bottom of the trading range that was going on mid-November to mid-December.
- The bears tried reversing the market again on Thursday, but bulls reversed and closed the day as a bull bar above Wednesday.
- Friday gapped down but reversed and ended up above Thursday high.
- This is as good as the bulls could do given the context. The problem is that they are back at resistance – weekly EMA.
- The daily and weekly EMAs are close enough and the market is between them. Tuesday and Wednesday covered most of the gap between them, and then Thursday and Friday went sideways to up to be contained by the weekly EMA.
- The bears tried reversing the market twice – on Monday, and Thursday and the bulls reversed both strongly. Given the strength this week, there should be another leg up.
- The daily and weekly EMAs are close enough that the market may have to go sideways till both EMAs are flat and close enough to each other that the bulls can break up above both in an upcoming week.
- The bulls would like the market to be above the right shoulder low so that they still have a chance at the Measured Move (MM) target of the Inverse Head and Shoulder (IVH).
Market analysis reports archive
You can access all weekend reports on the Market Analysis page.


Thanks for the report Rajesh. I read your previous comment but couldn’t respond earlier due to a whirlwind of a week I had.
Given the strength of the bull rally this week(albeit minor, which might turn out to be. major), do you think a TR(and a sideways than down move from the earlier bear selloff) is now more likely than a broad bear channel? Seems like the market is set to attempt a bull MTR soon. What are your thoughts?
Regards,
Abir Chatterjee
Abir, can you see if my last two bullet points in the weekly section answer your question.