Weekly Emini chart pullback from triangle breakout
I will update again at the end of the day
Pre-Open market analysis
The candle stick on the weekly chart last week closed near its high. It is therefore a buy signal bar for a 3 bar pullback from a breakout above a 3 month triangle. The odds are that this week will go above last week’s high and trigger the buy signal.
However, since the chart is in the middle of a 4 month trading range, there is slightly less probability that the breakout will be successful. The odds still favor the bulls, but not by much. As long as a chart is in a trading range, like the daily and weekly charts are, there is always at least a 40% chance of a bear breakout below the range.
Overnight Emini Globex trading
The Emini is up 10 points in the Globex session. Therefore, today might gap up and test May 22 high. Since there is no significant resistance above that high until the March 12 high of 2807.25, a breakout this week could lead to a quick rally to above 2800. This increases the chances of a series of bull trend days this week.
While the Emini might fail again just below 2750 as it has for 2 months, it will more likely work up to 2800. If it were to fail again around 2750, it could do so with consecutive strong bear trend days at some point this week. However, the odds favor the bulls after the strong early May rally and with the important 2800 magnet above.
Most of the days over the past 4 weeks have been trading range days. Therefore, that is what is most likely today. However, the context is good for a bull breakout.
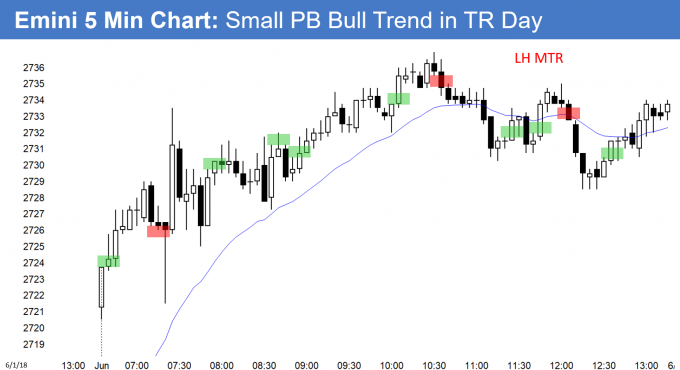
Yesterday’s setups
Here are several reasonable stop entry setups from Friday. I sometimes also show limit order entries and entries on the close of bars.
EURUSD Forex market 300 pip bear rally
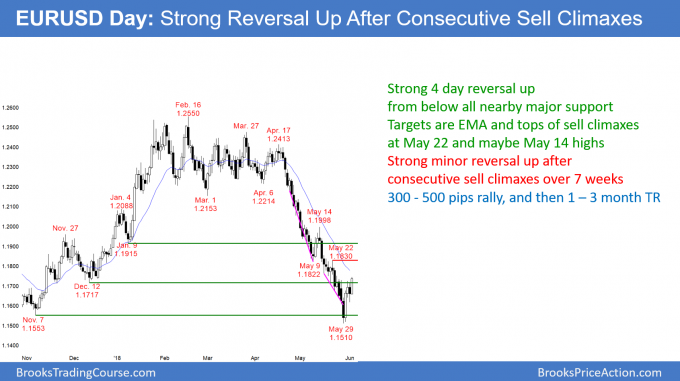
The EURUSD daily Forex chart reversed up 200 pips from major support after consecutive sell climaxes. This bear rally will likely pull back from around the EMA and then lead to a trading range for 1 – 3 months.
The EURUSD daily Forex chart rallied strongly for 4 days after reversing up from below the November 7 bottom of a 3 month sell climax. The rally will probably test the May 22 high around 1.1800, which is the top of the most recent sell climax. It may get back to the May 14 high at around 1.200 within a couple of months.
The 1st target is the EMA, which is just above 1.1750. Consecutive sell climaxes usually lead to a trading range, and the range usually has at least half as many bars as the sell climax. Since the sell climax lasted a couple of months, the developing trading range will probably last at least a month.
The market is reversing up from below the August to December trading range. Since that price range contained the trading for 4 months, it might do so again.
The EURUSD daily Forex chart is still in a bear trend
The daily chart is still in a strong bear trend. Consequently, the odds favor a 2nd leg down. However, after consecutive sell climaxes down to support, that 2nd leg down will probably find buyers around the bottom of the sell climax. Therefore, the bears will take profits around last week’s low and the bulls will buy again.
This will create a double bottom. Since the 2 month bear channel is so tight, a rally from that double bottom will more likely simply be another leg in a developing trading range than the start of a bull trend.
Overnight EURUSD Forex trading
The EURUSD 5 minute Forex chart has rallied 300 pips over the past 4 days. However, the odds favor selling at around the 20 day EMA, which is just above 1.1750. Therefore, day traders will begin to look for sell setups for 30 – 50 pip swings down. The bulls will take profits around last week’s high and look to buy 30 – 50 pip selloffs. The legs are big enough for 20 pip scalps, but after the 1st 2 hours into today’s session, day traders will probably mostly scalp for 10 pips.
Traders willing to hold onto positions for 1 – 3 days will scalp for 50 – 100 pips. They will sell around last week’s high and the daily EMA, and look to buy a 50% or a 100 – 150 pip pullback.
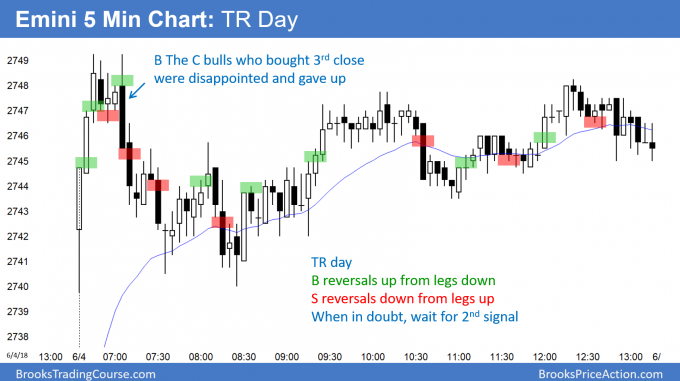
Summary of today’s S&P Emini futures price action and what to expect tomorrow
Today gapped above last week’s high and therefore triggered a weekly buy signal. However, the day was a trading range day.
Today triggered a weekly buy signal, but the breakout above last week’s high was small. That increases the odds of a failed breakout. Yet, the daily and weekly charts are Always In Long. Furthermore, there is no resistance above last month’s high until 2800 and the March high.
The odds favor a continued rally up to the March high. At that point, traders will decide between a breakout to a new all-time high or a reversal down from a double top lower high major trend reversal.
Since most days over the past month have been mostly trading range days, that is what is likely again tomorrow.
See the weekly update for a discussion of the price action on the weekly candlestick chart and for what to expect going into next week.
Traders can see the end of the day bar-by-bar price action report by signing up for free at BrooksPriceAction.com. I talk about the detailed S&P Emini futures price action real-time throughout the day in the BrooksPriceAction.com trading room. We offer a 2 day free trial.
When I mention time, it is USA Pacific Standard Time (the Emini day session opens at 6:30 am PST, and closes at 1:15 pm PST). You can read background information on the intraday market reports on the Intraday Market Update page.


