Weak Emini head and shoulders bottom breakout
Updated 6:52 a.m.
The Emini reversed up from below yesterday’s low on the open. Since yesterday had a small range, the bulls have a reasonable chance of forming an outside up day today.
The bears hope that the early rally is simply a pullback from the breakout below yesterday’s low. They therefore want an Opening Reversal down that will close the gap above Friday’s high.
Because most days over the past 4 months have been trading range days, the odds are that today will be either a small trading day or have both a swing up and a swing down.
Without a strong breakout up or down, traders will scalp. While the Emini is Always In Long at the moment, bears made money scalping and the bars are small with prominent tails. This increases the odds of a lot of trading range price action today. Furthermore, it increases the odds that the 1st 1 – 2 hours will be sideways.
Pre-Open Market Analysis
While the Emini gapped up yesterday on the daily chart above the 8 day range and the moving average, it was a doji day. It was therefore a weak entry bar for the bulls. The odds are that the 4 month trading range will continue. Hence, any rally will probably last only a day or two more. The 8 day tight trading range was a Head and Shoulders bottom on the 60 minute chart. Yet, most bottoms result in trading ranges and not bull trends.
As a result of the seasonal bullishness between October 26 and November 5, the bears will probably not be able to do much either. The Emini is probably waiting to see if the Republicans lose the House. While the Emini is in breakout mode, it is a mistake to conclude that to believe that you can predict the direction of the breakout based upon your opinion about the election. No one knows how many bull or bear dollars are waiting to buy or sell, no matter how the election turns out. In addition, the election might not be followed by a breakout. The trading range might continue indefinitely.
Yet, the big picture is the same. The Emini will probably close the gap above the July 2015 high of 2084.50. Furthermore, it will probably go to a new all time high. However, no one knows which will come first.
Overnight Emini Globex trading
While the Emini rallied and then sold off from an Expanding Triangle top of the 15 minute Globex chart overnight, it is still in a bull channel on the 60 minute chart. The problem that the bulls face is that the 2 day rally is still within a 4 month trading range where all rallies and selloffs have reversed after a few days. Hence, the odds are that the 2 day rally will reverse down today or tomorrow.
Yet, one of the breakout attempts will eventually succeed. The odds are still greater that the successful breakout will be down below the July 2015 high. In addition, because the Emini is in a bull trend on all higher-time frames, if there is a bear breakout, many bulls will be trapped. As a result, the bear breakout could be big (50 – 100 points) and last only a few days. Because that gap above the July 2015 came late in a bull trend, if the bull breakout comes 1st, it will probably not reach the measured move target just below 2400. Instead, it will probably reverse and close the gap at the July 2015 high.
Forex: Best trading strategies
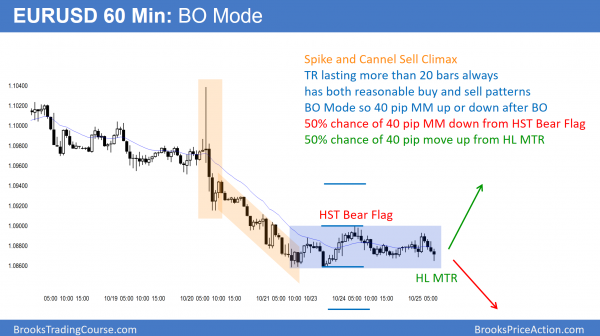
After the Spike and Channel sell climax, the 60 minute EURUSD Forex chart has been in a trading range. Because it has lasted far more than 20 bars, it is now in Breakout Mode. There is therefore a 50% chance that the breakout will be up and a 50% chance that it will be down. The minimum objective is a 40 pip Measured Move after the breakout.
The 60 minute EURUSD chart formed gap bars yesterday. This means that the bulls were strong enough to put bars entirely above the moving average. Therefore, there is a gap between the low of the bars and the moving average. When gap bars form late in a trend, the trend usually transitions into a trading range. Hence, the odds are that bulls will buy a selloff from these gap bars. As a result, the EURUSD 60 minute chart will try to form a Major Trend Reversal. The reversal attempt can come from a higher low or lower low. It probably will last at least 10 bars and have a least 2 legs.
Because only 40% of Major Trend Reversals lead to new trends, the odds are that the rally will become a bear flag. Yet, it might be strong enough for the bulls to make 50 pips. Especially relevant is the tightness of the bear channel on the daily chart over the past 3 weeks. This means that the bears are strong. Therefore, if there is a rally, it will probably be a bear flag. Hence, the daily chart will probably have at least one more small leg down before the bulls have much of a rally.
Overnight Forex sessions
The trading range on the 60 minute chart continued overnight. While the chart is in Breakout Mode, when a trading range forms late in a bear trend and then has a bear breakout, the trading range usually is the Final Bear Flag before a bigger pullback. Yet, the chart is in a bear trend. Therefore, whether or not the bulls get a bull breakout or a reversal up after a bear breakout, the odds are that the best the bears will get over the next week is a big trading range. Whatever rally comes will probably be a bull leg in a trading range or broad bear channel. Hence, traders will still look to sell rallies until there is a credible Major Trend Reversal on a higher time frame chart, like the 240 minute or daily chart.
Summary of today’s S&P Emini futures price action and what to expect tomorrow
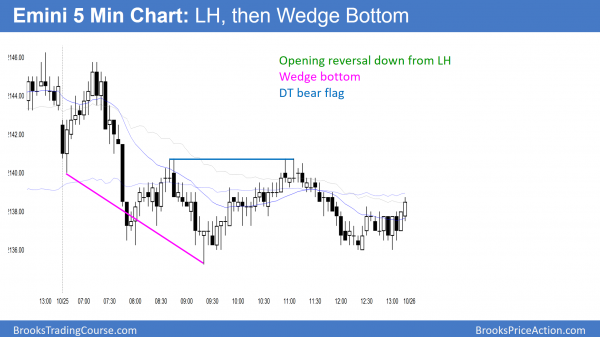
The Emini sold off from a test of yesterday’s lower high. After a wedge bottom, it remained in a trading range.
Since yesterday was a bar in a rally in a trading range on the daily chart, it was a sell signal bar. Today traded below its low and triggered the sell. Furthermore, it closed the gap above Friday’s high. As I wrote before the open, yesterday’s rally would probably fail either today or tomorrow because it is in a tight trading range. Today did not change anything.
See the weekly update for a discussion of the price action on the weekly candlestick chart and for what to expect going into next week.
Traders can see the end of the day bar-by-bar price action report by signing up for free at BrooksPriceAction.com. I talk about the detailed S&P Emini futures price action real-time throughout the day in the BrooksPriceAction.com trading room. We offer a 2 day free trial.
When I mention time, it is USA Pacific Standard Time (the Emini day session opens at 6:30 am PST, and closes at 1:15 pm PST). You can read background information on the intraday market reports on the Intraday Market Update page.


Al-
You may have commented on this but I didn’t see it….
The market seems stuck in TR malaise. What is going on? any speculation about the macro causes? Is the Fed “tuning” the S&P for political or catastrophe-avoidance reasons? Or is it just the way it is until it isn’t?
Thanks.
A 4 month tight trading range is unusual and it is a sign that the bears are finally strong enough to stop the bulls. Everyone knows that the mkt is overbought on the monthly chart. There is a credible top. Bulls bought all prior reversal attempts. They have been much less successful here. The trading range simply indicates a stalemate. The mkt is deciding whether it will get 1 more new high and then fall below the July 2015 high, or just fall below it without the new high. Everyone expects the selloff, and the hesitation is because there are still enough bulls betting on one more new high 1st. Traders accept it and simply buy low, sell high, and take quick profits. Once the market breaks into trend mode again, traders will hold onto positions longer.