Trump’s tariffs and trade wars causing pause in bull trend
Updated 6:41 a.m.
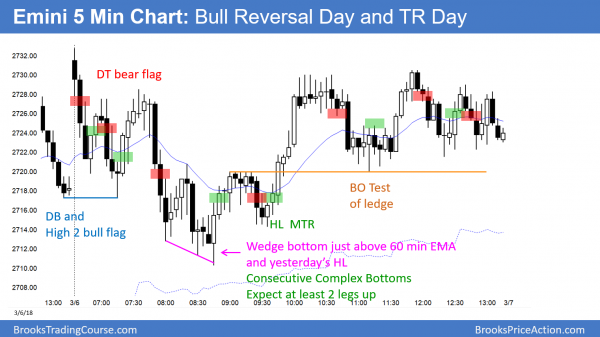
The Emini reversed up strongly on the open with a huge bull trend bar. The bears want an opening reversal down from the 60 minute moving average for an early high of the day. Yet, the bull bar is so big that a bear trend day is now unlikely. Since yesterday was not especially big, today could become an outside up day. If the bears can break strongly below the low, they will again have a chance at a bear trend day.
The bulls need follow-through buying if today is to become a bull trend day. Since the big gap down and the big reversal up creates confusion, the Emini might go sideways for an hour. At the moment, it is Always In Long and the odds favor either a bull trend day or a trading range day.
Pre-Open market analysis
After 2 strong bull days, yesterday was a trading range day. The 2 bull days were strong enough so that the odds favor at least one more small leg up. There is a measured move target above 2740 on the 60 minute chart. Additionally, the 2750 Big Round Number is also a magnet. Yet, Cohn resigned and the Emini fell overnight. Consequently, the 2nd leg down from the month-long wedge might have begun.
Today will be an information day. If it is a strong bear day, then the Emini will probably sell off for a few days. It would then probably complete its objective of 2 legs down from the wedge. Alternatively, if today is neutral to up, it still might reach the 2750 area before the 2nd leg down begins.
Since the monthly chart is so bullish, a 2nd leg down on the daily chart could mark the end of the 2 month correction. Therefore, traders should look for a reversal up from around 2600 – 2650 to a test of the all-time high.
Possible High 2 bull flag at the moving average on the weekly chart
It is possible that a gap down today could be the end of the 2nd leg sideways to down correction from the wedge. The bulls are trying to form a buy signal bar on the weekly chart. If this week closes near its high, this week would be a good buy signal bar. In addition, it would be the 2nd one in 3 weeks. It would therefore be a High 2 bull flag at the moving average in a bull trend. That is a reliable buy signal.
Overnight Emini Globex trading
The Emini is down 19 points in the Globex session. But, Thursday and Friday were strongly up. The odds still favor a 2nd leg sideways to up after that strong 2 day rally. However, if the Emini reaches 2750 this week, the rally will probably fail. The target for the 2nd leg down from the wedge on the daily chart is 2600 – 2650.
Since the Emini is in a trading range on the daily chart, there is confusion. In addition, the bulls will be disappointed by today’s opening drop. However, the bears will be disappointed if today reverses back up.
The Emini is in the middle of a 2 month trading range. This is the area of maximum confusion and disappointment. The odds therefore are that today will have at least one swing up and one swing down. The Emini will decide in the 1st hour which will come first.
Because a 2nd leg down on the daily chart is likely to begin within a week, today has an increased chance of being a bear trend day. Since last week rallied strongly, today has an increased chance of being a bull trend day.
Furthermore, this week might close on its high and form a buy signal bar on the weekly chart. The lack of a compelling reason for the Emini to go strongly up or down increases the odds of the Emini trading sideways today and tomorrow.
Yesterday’s setups
Here are several reasonable stop entry setups from yesterday. I sometimes also show limit order entries and entries on the close of bars.
EURUSD bull leg in 2 month trading range
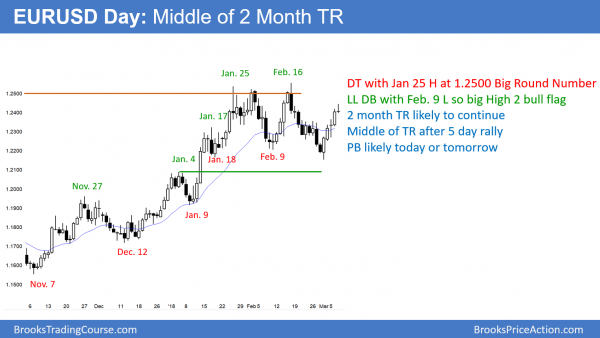
The EURUSD daily Forex chart has rallied for 5 days within a 2 month trading range. Since all trends within trading ranges are likely to fail, the odds favor 2 – 3 days of sideways to down trading.
After a 5 day rally on the EURUSD daily Forex chart, the odds favor a pause for several days. While the bulls want a break above the February 16 high, this rally lacks consecutive big bull bars. Furthermore, 80% of strong rallies and selloffs in trading ranges reverse. Although the weekly chart is in a bull trend and there is a bear trend line above the high, this rally will probably stall for a few days.
The bears want a lower high major trend reversal and a head and shoulders top. Yet, a 5 day bull micro channel usually has to form at least a micro double top before there is a reversal down. Consequently, the daily chart will likely go sideways for at least 2 – 3 days. After that, it is more likely to pull back 150 pips than rally 150 pips to a new high.
Overnight EURUSD Forex trading
The EURUSD 5 minute chart has been in a 40 pip range overnight. It will probably be mostly sideways for today and tomorrow. Therefore, day traders will scalp unless there is a strong breakout up or down.
The odds favor a 100 – 150 pip pullback starting this week. Yet, if the rally continues relentless up to above the January high, traders will conclude that it will reach the monthly bear trend line around 1.2650.
Summary of today’s S&P Emini futures price action and what to expect tomorrow
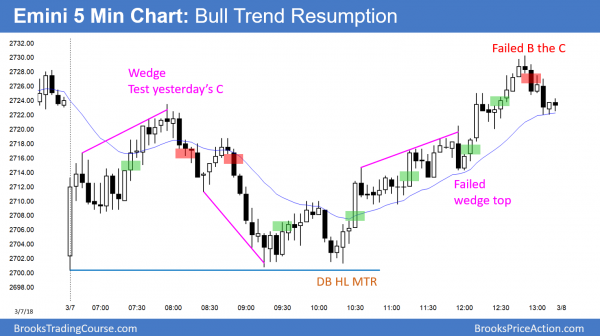
The Emini reversed up from below yesterday’s low. It sold off from a test of yesterday’s close. The bulls reversed it up again from a double bottom higher low test of the early low. This led to a resumption of the early bull trend.
The Emini reversed up strongly on the open and again on a test of the low. The daily chart has a wedge top, which makes a 2nd led down likely. However, the weekly chart has an ioi bull flag. The next 2 days will determine which will win.
See the weekly update for a discussion of the price action on the weekly candlestick chart and for what to expect going into next week.
Traders can see the end of the day bar-by-bar price action report by signing up for free at BrooksPriceAction.com. I talk about the detailed S&P Emini futures price action real-time throughout the day in the BrooksPriceAction.com trading room. We offer a 2 day free trial.
When I mention time, it is USA Pacific Standard Time (the Emini day session opens at 6:30 am PST, and closes at 1:15 pm PST). You can read background information on the intraday market reports on the Intraday Market Update page.


Hi Al,
Reference the EUR/USD analysis, could you please clarify how you come to the conclusion that there could be 100-150 pip pullback? As in the distance it may travel the, 100-150 pips.
Kind regards
Simon
Rallies and selloffs in trading ranges are more likely to reverse that begin trends. The range is 300 pips tall. Therefore, once a leg goes 200 pips, the odds start to favor an attempt at a reversal, or at least a pullback. Pullbacks in trading ranges usually retrace at least half of the prior leg. The current rally is about 200 pips. If instead the pullback grows into a reversal, it would test the bottom of the range. That is 200 pips below.
Ok great thank you Al for the reply.
Kind regards
Simon
yes just trying to get edumacated
please clarify. Al?
there is a bollinger band, I cant see what the moving averages is
the reason is it isn’t there. or it is but its just not distinctive.
I am showing a 20 day exponential moving average on the chart. I think most traders will not make money using Bollinger bands or any other type of band. I therefore do not show them. The more stuff a trader has on his chart, the more difficult it is to see what the market is trying to tell you.