Trump, hurricanes, DACA are inadequate Emini catalysts
Updated 6:45 a.m.
The Emini opened near yesterday’s high, but had small bars. This is therefore a continuation of the 3 hour range at the end of yesterday. Because yesterday is a weak buy signal bar in a 3 month range, the odds are that there will be sellers above its high. While any day can become a strong trend day, the context on the daily chart make a trend day less likely. In addition, today’s quiet open increases the chances of another quiet, mostly sideways day.
Because today is testing yesterday’s high and a trading range day is likely, if there is an initial rally, it probably will fail within a hour. The odds favor at least one swing up and down, each lasting 2 – 3 hours.
Pre-Open market analysis
The monthly Emini chart is in an 11 bar bull micro channel. While a sign of strong bulls, it is also a buy climax. Hence, a pullback is likely soon. In addition, it is at the resistance of a measured move up from the 2014 – 2015 trading range. Furthermore, it is at the 2500 Big Round Number.
When a trend is as strong as this, the downside risk is probably a 1 – 3 bar pullback. While that could be 150 points and a trend on the daily chart, the odds are that the bulls will buy the 1st pullback. This is because they have been so eager to buy that they have bought above the low of the past month for 11 bars. They will probably be eager to have an opportunity to buy below a prior month’s low.
Weekly buy climax
The pullback of 2 weeks ago got to within 1/2 point of touching the weekly moving average. Since it did not touch the average, this is now 43 weeks above the average price. This is an extreme buy climax. Yet, there is no clear top. Furthermore, the bull channel is tight. Consequently, the best the bears will probably get on the weekly chart is a trading range.
It could easily last several months and test the March low. However, when a bull channel is as tight as this one, the odds are that the best the bears can get is a bear leg in a trading range. Because the range could last 6 months or more after such an extreme buy climax, the height of the range could be big. A reasonable target is the March bottom of the current tight bull channel.
Daily chart in weak bull channel
The daily chart has had 2 pushes up from the bottom of the August 21 wedge bull flag. If there is a reversal down from above Tuesday’s high, the bears would have a wedge top. In addition, it would be a lower high major trend reversal. Furthermore, it would be a right shoulder of a head and shoulders top. If it reverses down before going above that high, the bears would have a double top lower high major trend reversal with the August 16 high.
While the Emini daily chart is in a bull trend, it has been mostly sideways for 4 months. Since there is no clear top yet, the odds are that it is in the early stages of transitioning into a bigger trading range. The low will probably be around the March or May lows. Since there is no clear to yet, there might be one more new high before that bear swing begins.
Because of the buy climaxes on the weekly and monthly charts, the odds are that the bears will sell a new high on the daily chart. While they will scalp at least part, they might swing trade some for a test of the March low.
Overnight Emini Globex trading
The Emini is down 1 point in the Globex market. In addition, yesterday was a doji day. It is therefore a weak buy and sell signal bar. The bulls want a strong break above yesterday’s high and then above the September 1 high. Yet, because the Emini has been sideways for several months, traders will continue to look to sell above prior bars and buy below. Furthermore, most days will probably continue to be mostly trading range days. Consequently, traders expect that trends will fail within a few hours and lead to opposite swings.
EURUSD Forex market trading strategies
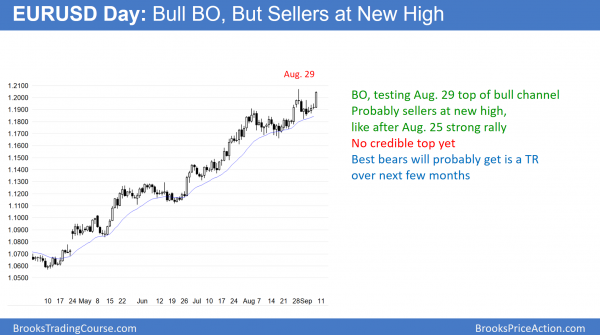
The daily EURUSD Forex chart is in a strong bull trend. Because the bears made money by selling the last breakout, they will sell again at a new high.
The monthly EURUSD Forex chart has had 6 consecutive bull trend bars. In addition the low of each of the past 9 bars has been above the low of that of the prior month. This is a 9 bar bull micro channel. Finally, the rally began as a final flag reversal up on the monthly chart. Since these are all signs of strong bulls, the odds are that the bulls will buy the 1st reversal down. Hence, even if there is a 50% pullback at some point over the next few months, the bulls will probably buy it. This is because there is about a 70% chance of a 2nd leg sideways to up after such a strong reversal.
Weekly chart has consecutive buy climaxes
The rally on the weekly chart has had a series of big bull bars without more than a 2 bar pullback. Since every bull trend bar is a buy climax, a series of 4 or more is an extreme buy climax. Consequently, the odds favor a transition into a trading range. It typical has to last at least 10 bars before the bulls will buy again.
This is because they want to be sure that there is not going to be a huge climactic reversal. Once they conclude that the bears are no longer willing to sell, the bulls will buy again. Therefore, the downside risk on the weekly chart is not great. While a pullback could correct 50% co the 2017 rally, the odds are that the best the bears will get is a bear leg in a trading range. They will probably need at least a 10 – 20 bar trading range before they can get at least a 40% chance of a trend reversal.
The trading range might have begun with the 2 bar pullback from 5 weeks ago. This is especially true because the monthly chart is testing the resistance at the bottom of a 15 year trading range. Furthermore, the 1.2000 Big Round Number is also resistance.
Finally, while there is no convincing top, consecutive buy climaxes usually lead to a trading range. As a result, the odds of much higher prices without a few months of sideways trading are 40%. The 9 month rally is about 1700 pips tall. There is support at the top of the 2 year trading range around 1.1500. Consequently, the bottom of the range will probably hold above that level.
Daily EURUSD Forex chart showing signs of a trading range
The daily chart was in a tight trading range in August and again for 2 weeks. This is a sign that the bulls are losing momentum.
Furthermore, the daily EURUSD Forex chart shows that bears have been able to make money by selling above prior highs for 2 months. This is an early sign that a tight bull channel is losing momentum. Since there is a 75% chance that a bull channel will lead to a trading range, the odds are that the evolution has probably begun. A reasonable target for the bottom of the range is the August 17 major higher low.
Yet, while the August 29 reversal above 1.2000, the selling since then has lacked consecutive big bear bars. Therefore, the daily chart will probably have to go sideways more. This is because it will probably need a more convincing top. The pattern so far does not have enough bars for a major reversal on the daily chart. In addition, there has not been a huge reversal down. Consequently, the odds favor more sideways to up trading before the chart is clearly in a trading range.
Overnight EURUSD Forex trading
The 240 minute EURUSD chart had a Big Up, Big Down pattern at the August 29 high. As a result, a trading range was likely. The rally up over the past week has had many reversals. It therefore looks like a bull leg in a trading range and not a resumption of the bull trend.
The 5 minute chart had been in a 30 pip range for 5 hours. While there was a bull breakout 10 minutes ago, the bulls need follow-through if the breakout will be successful. More likely, the upside will not be great, given the recent trading range trading. As a result, day traders are scalping, waiting for a strong breakout with strong follow-through.
Summary of today’s S&P Emini futures price action and what to expect tomorrow
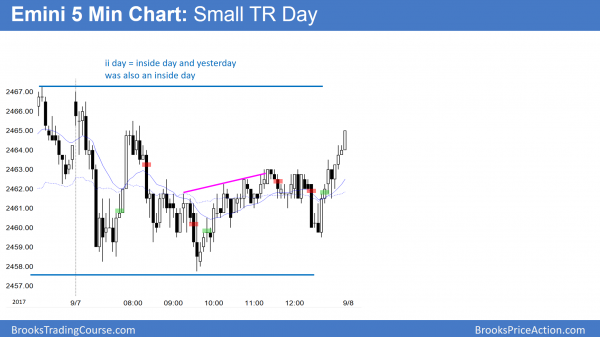
The Emini was a small trading range day, and it was an ii day on the daily chart.
Today was mostly a limit order day. It traded in a small range within yesterday’s range. There is now an ii on the daily chart in the middle of a 2 month trading range. Tomorrow will likely be another mostly trading range day. However, after an ii on the daily chart, there is an increase chance of a trend day. Until there is a strong breakout with follow-through, traders will continue to look for reversals and scalps.
See the weekly update for a discussion of the price action on the weekly candlestick chart and for what to expect going into next week.
Traders can see the end of the day bar-by-bar price action report by signing up for free at BrooksPriceAction.com. I talk about the detailed S&P Emini futures price action real-time throughout the day in the BrooksPriceAction.com trading room. We offer a 2 day free trial.
When I mention time, it is USA Pacific Standard Time (the Emini day session opens at 6:30 am PST, and closes at 1:15 pm PST). You can read background information on the intraday market reports on the Intraday Market Update page.


