Bear rally in correction giving back 2017 Trump rally gains
Updated 6:54 a.m.
While the Emini rallied on the open, it was in yesterday’s trading range. Yesterday is a buy signal bar on the daily chart and the bottom of a 2 legged pullback to the 50 day moving average. Traders want to see if there are buyers or sellers above. This is an early test of that buy signal bar high.
The bears got an opening reversal down from the moving average and a test of yesterday’s high. Yet, they need a strong break below the trading range to make traders believe that this will be the start of a bear trend day. More likely, there will be buyers around the bottom of the range and the range will continue.
While it is possible that today can still be a bull trend day, that is unlikely. The odds are that today will have a lot of trading range trading, continuing the 5 hour trading range.
Pre-Open market analysis
While yesterday opened with a big gap down, the bulls created a small pullback bull trend day. Furthermore, they closed the gap, which is a sign of buying pressure. The bull trend evolved into a trading range for the rest of the day. This therefore means that the bears, too, were strong.
Since last week’s bear breakout was so strong, the bears are still in control. The bulls need a breakout above the high of 2 weeks ago before traders believe the bull trend has resumed.
The Emini is probably in an early bear trend down to the 2016 close on the daily chart. Since the weekly and monthly charts are in strong bull trends, this selloff is still a bull flag on those charts. Because the bears have been unable to create consecutive big bear trend bars, this selloff is probably a bear leg in what will end up as a big trading range over the next 2 months. Since the target is still far below, the odds are that the selloff will be in a bear channel for another month or more.
The bulls see yesterday on the daily chart as a two legged correction down to the 50 day moving average. Yet, the month long selloff has been in a tight bear channel. Even though yesterday was a buy signal bar, the 1st reversal up would therefore likely be minor.
Bear reversal bar on the monthly chart
This is the end of the month. The trading over the next 4 days therefore determines how bearish this month’s bar will be on the monthly chart. Will the month close on its low and therefore be a stronger sell signal bar? Or, will it have a big tail on the bottom and be a weaker sell signal bar? In either case, the Emini is probably at the start of a 1 – 3 month pullback.
Overnight Emini Globex trading
The Emini is down 3 points in the Globex market. Since yesterday was a small pullback bull trend day, the bulls are probably exhausted. While there is a 50% chance of follow-through buying in the 1st 2 hours, there is a 75% chance of at least a couple hours of sideways to down trading that starts by the end of the 2nd hour.
Since the Emini is probably in the early stages of a 5% correction, traders should be thinking about how the correction will unfold. At the moment, the odds favor a broad bear channel where every new low leads to a strong reversal back up. In addition, every strong reversal up fails in the middle third of the last leg down.
EURUSD Forex market trading strategies
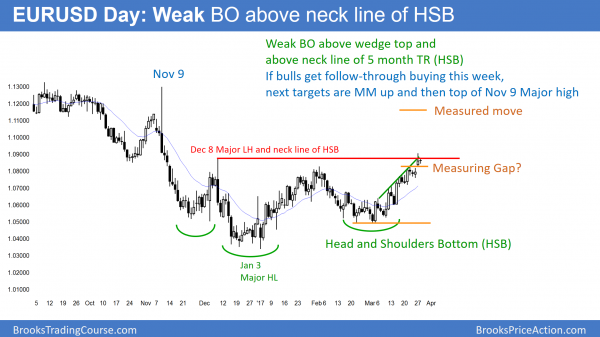
While the EURUSD daily Forex chart yesterday broke above the top of the 5 month trading range, it closed below the top. This is therefore not yet a strong breakout.
The EURUSD Forex market has been in a trading range for 5 months. Since most trading range breakouts fail, the odds are that the current one will as well. Yet, there is no top. Hence, the EURUSD Forex market is deciding whether this breakout will succeed or tail. The bulls need a one or more big bull trend bars closing on their highs. In addition, they need at least a couple closes above the December 8 neck line of the head and shoulders bottom. Without that, the breakout will simply be a probe above the resistance at the top of the trading range.
Because the 5 week rally has been in a tight channel, the bears will probably need at least a micro double top. Traders would like to see a couple breakout attempts fail before they will bet that the breakout will fail. Hence, bulls will probably buy the 1st reversal down. They will therefore probably try to get a strong breakout at least one more time.
Wedge on 240 minute chart so series of buy climaxes
The rally on the 240 minute chart has a series of buy climaxes. Since that is exhaustive price action, it increases the chances of at least a pause or a pullback before the bulls will try again. Yet, when there is a wedge bull channel like this, the bulls still have a 25% chance of a strong breakout above the channel. But, that means that there is a 75% chance of a bear breakout below the channel. That breakout can come from the EURUSD simply going sideways instead of down. That is what is likely over the next several days.
Overnight EURUSD Forex trading
The EURUSD Forex market has been in a 20 pip range for the past 5 hours. In addition, the range is just below the top of the 5 month trading range. Furthermore, it is at the top of a wedge channel. Therefore, the odds are that it will go mostly sideways for another day or two. Because it is testing the top of a trading range, there is an increased chance of a trend up or down. Yet, as I wrote above, there is enough bull strength to make a big reversal down unlikely for at least a few days. In addition, the bulls have a buy climax. They therefore are probably exhausted and will likely need a day or two before they will try to breakout again.
Summary of today’s S&P Emini futures price action and what to expect tomorrow
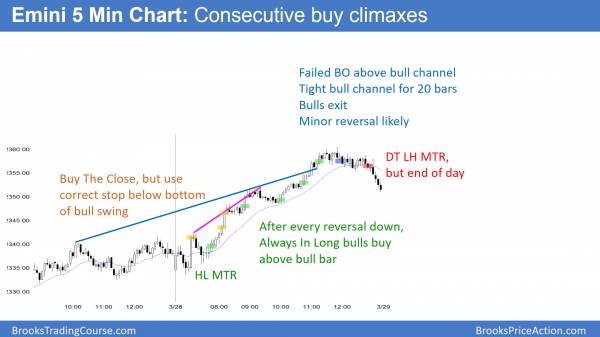
The Emini rallied strongly, but had consecutive buy climaxes. It reversed down from a breakout above the top of the bull channel and from above last week’s lower high.
While the Emini had 2 consecutive bull trend days, the buying was climactic. Therefore, the odds favor sideways to down trading tomorrow. In addition, it will now probably fall to the bottom of the 2 day channel. The 2 day rally is probably just part of a bear channel on the daily chart.
See the weekly update for a discussion of the price action on the weekly candlestick chart and for what to expect going into next week.
Traders can see the end of the day bar-by-bar price action report by signing up for free at BrooksPriceAction.com. I talk about the detailed S&P Emini futures price action real-time throughout the day in the BrooksPriceAction.com trading room. We offer a 2 day free trial.
When I mention time, it is USA Pacific Standard Time (the Emini day session opens at 6:30 am PST, and closes at 1:15 pm PST). You can read background information on the intraday market reports on the Intraday Market Update page.


