Emini weekly sell signal for double top with January high
I will update again at the end of the day.
Pre-Open market analysis
Last week formed a reversal bar on the weekly chart. While it was not a big bear bar, the context is good for the bears. They now have a credible double top with the January high. However, the weekly bull channel is tight. Therefore, this is probably a minor reversal than the start of a swing down. A minor reversal means that a bull flag is more likely than a bear trend.
This week is the entry bar for the bears on the weekly chart. If they can create a series of bear days, the odds will favor a deeper pullback to the middle of the 7 month trading range. However, if the bear bars are not big and not consecutive, the selloff will probably only last 1 – 3 weeks. Then, the bulls will try again to get above the January high.
Friday was a doji bar on the daily chart. It therefore was not a strong day for the bears. A gap up today or any day this week will create an island bottom. That would erase the bearishness of last week’s island top. However, at the moment, the Emini will probably pull back for a couple more weeks.
Overnight Emini Globex trading
The Emini is down 1 point in the Globex session. After Friday’s late big reversal up, traders are now less certain of lower prices. Confusion usually results in a trading range. The bulls want Friday to be the end of a 3 day selloff. They see it as a 3 day bull flag. But, the bears want it to be a major reversal down. While the odds favor the bulls over the next month or two, the selloff was strong enough to make sideways to down likely for a week or two.
When a market is in a trading range, legs up and down usually only last 1 – 3 days. In addition, the uncertainty exists on small time frames as well. The 5 minute chart spends more time going sideways.
The 1st target for the bulls is Friday’s high. If they can break strongly above it, they will try to close the gap below Thursday’s low. Both are resistance areas, and the bears will sell there.
The bears want a breakout below the August 2nd buy climax low. That is their target over the next few weeks.
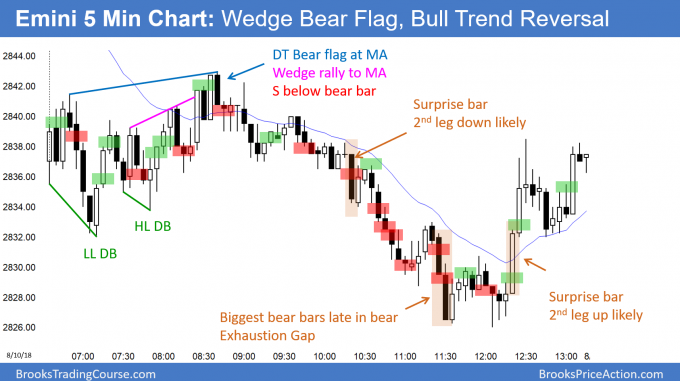
Friday’s setups
Here are several reasonable stop entry setups from Friday. I sometimes also show limit order entries and entries on the close of bars. My goal with these charts is to present an Always In perspective. If a trader was trying to be Always In or nearly Always In a position all day, and he was not in a position at the moment, these entries would be logical times for him to enter.
EURUSD Forex pullback from bear breakout of trading range
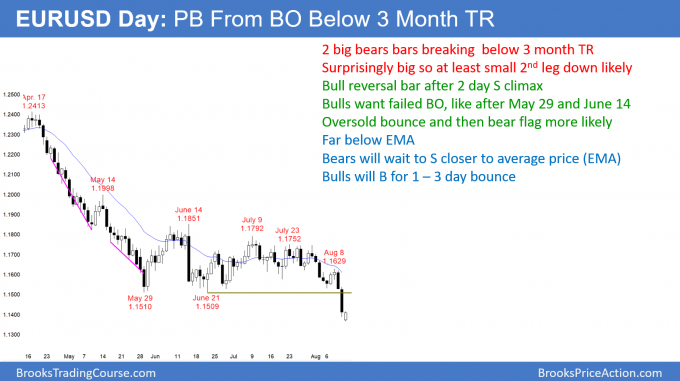
The EURUSD daily Forex chart has a bull trend bar so far today. But, after 2 surprisingly big bear bars, a minor reversal and a bear flag are more likely than a bull trend reversal.
The EURUSD daily Forex chart broke strongly below the 3 month trading range on the daily chart. The 3 week selloff has been strong and the bears have a measured move target at around 1.12.
But, the price is now far below average (the 20 day EMA). There are fewer bears willing to sell this low. They prefer to sell closer to the average price. The bulls know that and they therefore are willing to buy for a 1 – 3 day bounce.
With a relative absence of bears and now some aggressive bulls here, the selling will probably stop for a few days. The result will probably be several days of sideways to up trading.
Bull flag on the weekly chart
It is important to note that the bears do not have consecutive bear bars that both close below the June 21 bottom of the range. Today will likely close below, but it might have a bull body. That would be a sign of a weaker bear breakout.
In addition, the bull trend in 2017 was very strong, The selloff since February is more likely only a pullback in that trend on the weekly chart. The pullback is now around 50%. Also, it is a Breakout Test of the top of the 2015 – 2016 trading range. Therefore, even if the selloff continues down to the 1.12 measured move target, the bulls would then probably get a rally back to the June high. That rally would probably last many months.
Overnight EURUSD Forex trading
The EURUSD 5 minute Forex chart has rallied 40 pips in the past 2 hours, reversing an early selloff in the European session. This is probably a sign that the bears are taking partial profits and bull scalpers are beginning to buy. Consequently, the 60 minute chart will begin to enter a trading range for a few days. This rally is the 1st leg up in that range, and today might not be the final bottom of the range.
When a market enters a trading range, there are swings up and down. Day traders will therefore be more willing to hold onto positions for 30 – 50 pip swings. Furthermore, scalpers will trade reversals for 10 – 20 pip scalps.
Summary of today’s S&P Emini futures price action and what to expect tomorrow
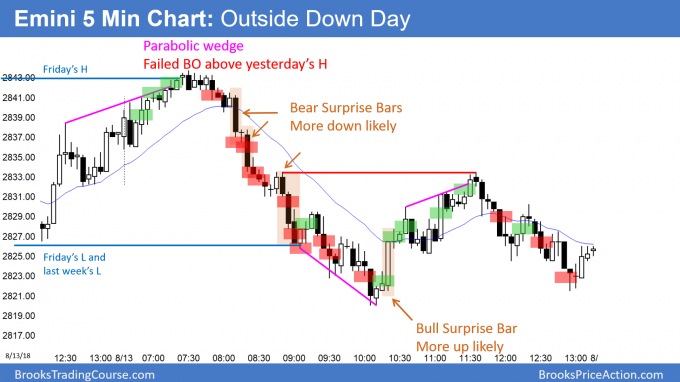
Here are several reasonable stop entry setups for today. I sometimes also show limit order entries and entries on the close of bars. My goal with these charts is to present an Always In perspective. If a trader was trying to be Always In or nearly Always In a position all day, and he was not in a position at the moment, these entries would be logical times for him to enter.
The Emini traded above Friday’s high and then below its low. It therefore formed an outside down day. By going above Friday’s high, it triggered a daily buy signal. Once it went below last week’s low, it triggered a weekly sell signal. When there are conflicting signals, the Emini usually goes sideways for a few days as the bulls and bears fight for control. This is more likely after 2 doji days and 3 other small days.
Since the daily chart was overbought and at the January high, the odds still favor a 1 – 3 week pullback before a new all-time high.
See the weekly update for a discussion of the price action on the weekly candlestick chart and for what to expect going into next week.
Traders can see the end of the day bar-by-bar price action report by signing up for free at BrooksPriceAction.com. I talk about the detailed S&P Emini futures price action real-time throughout the day in the BrooksPriceAction.com trading room. We offer a 2 day free trial.
When I mention time, it is USA Pacific Standard Time (the Emini day session opens at 6:30 am PST, and closes at 1:15 pm PST). You can read background information on the intraday market reports on the Intraday Market Update page.


Al
Regarding your comments on today’s price action, the e-mini at EOD closed near the day’s low and below yesterday’s low. Also since it went only marginally above yesterday’s high, could this reversal not be characterized as a double top reversal. The daily chart today appears more like a sell signal than a buy signal. In that case we would have sell signals both on the daily chart and the weekly chart at EOD today. Is this view reasonable?
Thanks
Yes, it is a double top. I talked about that in the chat room yesterday. There is a double top bear flag on the 60 minute chart and a micro double top on the daily chart.
There clearly is a sell signal on the daily chart. The Emini gapped down from a micro double top and a double top with the January high. However, is yesterday a reliable sell signal bar for today? I would not sell today below yesterday’s low. It closed just above the 20 day EMA and it is around a 50% pullback from the rally 2 weeks ago, Finally, Friday was a doji so the selling was not strong into the close. I would wait to see how strong the bear breakout was, and then sell lower if it was strong.