Stock market election selloff should test 2050 support
Updatted 6:47 a.m.
The Emini reversed up on the 1st bar, forming a double bottom with yesterday’s low. Furthermore, yesterday reversed up from a 3 day wedge bottom on the 15 minute chart. Therefore, the Emini will probably go sideways to up for about 10 bars on that chart, or 3 – 4 hours.
The initial buy signal bar today was a big doji. There was an early reversal down. Yesterday was in a tight trading range for several hours The rally at the end of yesterday was week. Hence, the odds are that today will have a lot of trading range price action. Therefore, a strong trend day is unlikely.
Yet, there were 6 consecutive bear days. Yesterday ended with a nested wedge. It met the 2 targets of a 100 point pullback and a test below the July 2015 high. Today had an early reversal up. Therefore the odds are that today will be a bull day, and possibly a bull trend day. If so, it will probably be a weak bull trend, like a broad bull channel. Furthermore, it will probably spend a lot of time sideways.
Pre-Open Market Analysis
Yesterday was the 6th day down, and it reversed up from a wedge bottom. The odds are that it will be sideways to up for a day or two.
It finally closed the gap above the July 2015 top of the 2 year trading range. Hence, the gap is an exhaustion gap. Yet, the odds are that the Emini will probably fall to the next support levels below. This is true even if it rallies 30 points into the election. The 1st support is the July 6, 2016 bottom of the 1st pullback from the June bull reversal. The next is the June 29 gap below 2035.75.
I have mentioned several times that the August high formed a double top in a tight trading range. I furthermore said that this often leads to two legs down, where the 2nd is climactic. Finally, I said that bulls usually buy the selloff. As a result, there is usually a climactic reversal up. Therefore, traders should look to buy a reversal up from the 2040 – 2060 area. While the rally might led to a new all-time high, that is not the goal. The minimum goal is several days of strong buying. Hence, it might end at a lower high.
Overnight Emini Globex trading
The Emini is up 3 points after a sideways Globex session. Because the Emini fell to a 3 day wedge bottom yesterday, the odds are that it will go sideways to up today. While it could always fall further, especially with other support below pulling it down, the wedge makes a bounce likely first.
Remember what I have written about repeatedly since the August tight trading range double top. Typically, a 2nd leg down from such a top usually falls far, yet reverses up sharply. The Emini will probably need at least a micro double bottom before the reversal. Furthermore, it will probably have to test lower support in the 2040 – 2060 area before the bulls become eager to buy. A sell climax is likely and the election is a possible catalyst. Hence, the reversal back up could start after next week’s election.
Forex: Best trading strategies
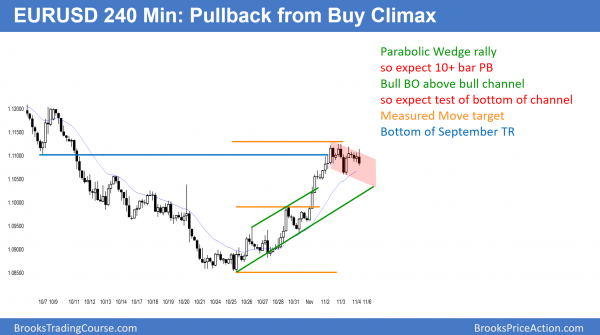
After a Parabolic Wedge buy climax, the odds favor a tight bear channel for at least 10 bears. Following a bull breakout above a bull channel. there is a 75% chance of a test of the bottom of the channel.
While the daily chart held up yesterday after an early selloff, the rally is at resistance. It is a buy vacuum test of the bottom of the September trading range. Since the 2 week rally is in a parabolic wedge, the odds are that the EURUSD will trade sideways to down for several days. Then, probably after the election, traders will decide if the rally will break above resistance and test the September 26 lower high of 1.1279. The bears want a bear breakout below the developing bull flag and then a test of the October low. Because the daily chart has a Big Down Big Up pattern over the past few weeks, the odds are that the market is confused. It therefore will probably be mostly sideways for a week or more.
Overnight EURUSD Forex sessions
While the 9 day rally has been strong, it was a Parabolic Wedge test of resistance. Furthermore, it broke above a tight bull channel on the 240 minute chart. The odds are that the sideways to down pullback that began yesterday will continue at least to the bottom of the channel. Because the channel was tight, the EURUSD can reach it by mostly going sideways. As a result of this buy climax, the EURUSD Forex market will probably be sideways for at least a couple more days. Hence, it will probably wait until after the election before deciding whether to continue up or test back down.
Summary of today’s S&P Emini futures price action and what to expect tomorrow
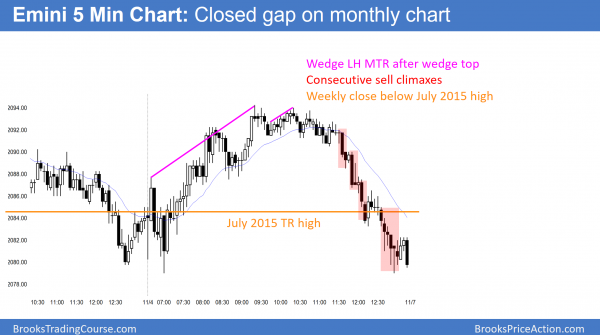
The Emini had a weak rally that ended with a wedge top just below the 60 minute moving average. After a small wedge lower high major trend reversal, it had consecutive sell climaxes. This was a weekly close below the July 2015 top of the 2 year trading range.
The Emini closed below the July 2015 top of the 2 year trading range on the weekly and daily charts today. It is in a climactic 2nd leg down from the tight trading range double top in August. It will probably reverse up sharply next week from support in the 2040 – 2060 area. Less likely, it will fall to the June bull trend low.
See the weekly update for a discussion of the price action on the weekly candlestick chart and for what to expect going into next week.
Traders can see the end of the day bar-by-bar price action report by signing up for free at BrooksPriceAction.com. I talk about the detailed S&P Emini futures price action real-time throughout the day in the BrooksPriceAction.com trading room. We offer a 2 day free trial.
When I mention time, it is USA Pacific Standard Time (the Emini day session opens at 6:30 am PST, and closes at 1:15 pm PST). You can read background information on the intraday market reports on the Intraday Market Update page.


I don’t know if you are in the trading room, but I said several times that the rally looked more like a bull leg in a trading range than in a bull trend, and that it would probably test down to the bottom of the pullback after the breakout (2088 area), and maybe to the open of the day. I also said that the odds are that the low of the day would hold. I did not expect a selloff to the low, but the low did hold.
Thank you.