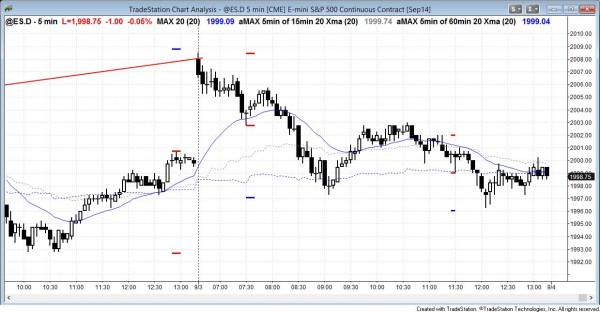
The S&P500 Emini sold off from the first bar with an expanding triangle trend reversal.
End of day comments about today’s Emini price action and day trading
The Emini sold off from the first bar of the day with an expanding triangle trend reversal, but then bounced up off of the 60 minute moving average at a measured move down. It rallied strongly, but then sold off again, this time from a lower high major trend reversal to a new low of the day.
The bear candle on the daily chart is now a sell signal bar for a buy climax top; it is the second entry. The bull channel is tight so the probability is low (this means that the short will probably lose money), but the reward is much bigger than the risk so the trade is acceptable. However, it is better for most traders to wait for a higher probability sell setup because the bull trend is so strong. This means that they will wait for a strong bear breakout before shorting.
S&P500 Emini intraday market update for price action day traders
Time of update 8:04 a.m. PST.
The Emini gapped up to a new all-time high, but had a quiet open that had many small dojis in a tight trading range. The stock market sold off slightly on the first bar with an expanding triangle trend reversal at a measured move target and a leg 1 = leg 2 measured move target, but the selloff did not have big, consecutive bear trend bars. This, plus all of the dojis in the first hour, increased the chances that the day would have a lot of trading range price action. Until there is a strong breakout up or down, the Emini will probably remain in a trading range or a broad bear channel. For the first hour, day traders only had a couple of scalping opportunities.
The Emini had a bull opening reversal up from the moving average, but the reversal up was weak. This is more trading range price action. Although this is a possible low of the day and the start of a bull trend, there is no evidence for this yet. The bulls need a strong breakout with follow-through to turn this into a bull trend day. The day opened 15 points above the low of yesterday’s final rally. This is a big move up and the Emini might have to go sideways for 30 or more bars before it can decide whether to resume up (maybe from a double bottom) or reverse down (like from a lower high major trend reversal).
In general, when traders are uncertain, they tend to sell as the stock market goes up and they scale in higher, and they buy and scale in lower as it goes down. Because of the uncertainty, both sides scalp. When traders are buying low, selling high, and scalping, their day trades create a trading range.
S&P500 Emini monthly and weekly candle charts
The daily, weekly, and monthly Emini charts are all in strong bull trends, but overbought. There is no sign of a top yet. The 60 minute chart had a moving average gap bar (high below the moving average) last week, and that usually is followed by one final rally. Then, a major trend reversal typically forms and it has a couple of swings down, and then the stock market tends to evolve into a trading range. At that point, it decides between trend resumption up and trend reversal down. The Emini is currently searching for the top that will lead to those two legs down, but it does not yet have a convincing setup.
The downside on the monthly chart is probably limited to a few bars (months) because it is in a small pullback bull trend, which is the strongest type of trend. The first reversal attempt usually does not last long and it typically becomes a bull flag.
See the weekly update for a discussion of the weekly chart.
Traders can see the end of the day bar-by-bar price action report by signing up for free at BrooksPriceAction.com. I talk about the detailed Emini price action real-time throughout the day in the BrooksPriceAction.com trading room, and a 2 day free trial is available.
When I mention time, it is USA Pacific Standard Time (the Emini day session opens at 6:30 am PST, and closes at 1:15 pm PST). You can read background information on the intraday market reports on the Intraday Market Update page.

