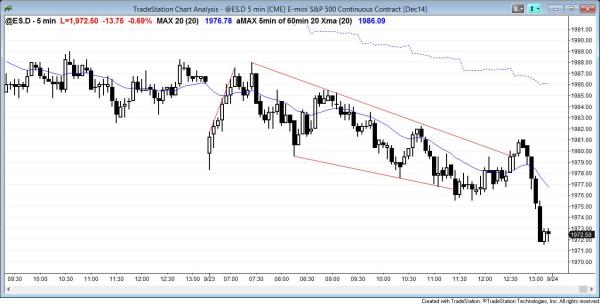
The Emini opened with a final flag bull trend reversal, but it then entered a bear channel and became a trading range day. It collapsed in a strong bear breakout in the final bars.
End of day comments about today’s Emini price action and day trading
The Emini reversed up sharply from the breakout below yesterday’s low. Yesterday’s trading range became the final flag in the 2 day selloff. The Emini reversed back down strongly from the top of that trading range to a new low of the day. There were repeated reversals throughout the day and this type or price action led to a trading range day until the close. The market sold off strongly in the final minutes, which is more common when the daily chart is entering a bear phase.
S&P500 Emini intraday market update for price action day traders
Time of update 7:02 a.m. PST.
The Emini had a final flag bull trend reversal on the open. This will probably be the dominant price action feature of the day. As long as the bears do not create a strong top or have a strong bear reversal, the day will probably be a bull trend day or a trading range day. Traders should focus on buying pullbacks and possibly swinging part of their position until the price action changes. The odds are high at the moment that any pullback will be followed by a second leg up. However, the pullback might last an hour or two. September 16 is an example of similar price action.
The bears will try to create a bear breakout and a reversal down, but the bull case is more likely unless the bears can create a strong bear breakout.
S&P500 Emini 60 minute, daily, weekly, and monthly candle charts
The Emini is near the bottom of the 60 minute trading range so buyers were likely to come in. The bulls see the entire 3 day selloff as a pullback from last week’s sharp rally.
See the weekly update for a discussion of the weekly chart.
Traders can see the end of the day bar-by-bar price action report by signing up for free at BrooksPriceAction.com. I talk about the detailed Emini price action real-time throughout the day in the BrooksPriceAction.com trading room, and a 2 day free trial is available.
When I mention time, it is USA Pacific Standard Time (the Emini day session opens at 6:30 am PST, and closes at 1:15 pm PST). You can read background information on the intraday market reports on the Intraday Market Update page.

