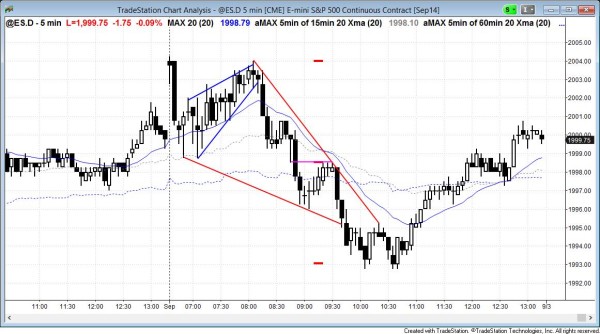
The Emini reversed down on the open from above the all-time high, which was also the high of last week and last month. It reversed back up from just above yesterday’s low.
End of day comments about today’s Emini price action and day trading
The Emini is overbought on all time frames and can correct at any time. It reversed down from above last week’s and last month’s high, which was the all-time high. However, it sold off in consecutive sell climaxes, and a climactic move is usually followed by a trading range. The Emini reversed up from a double bottom that formed just above yesterday’s low. The rally was strong enough to make a second leg up likely after any pullback, which could form a higher low major trend reversal and lead to a second leg up tomorrow.
The Emini has been in a trading range for 6 days. The bulls want trend resumption and a measured move up. The bears want a major trend reversal and a measured move down. The probabilities are about the same for both. If there is a bull breakout, the trading range might become the final bull flag. This could lead to a reversal down.
S&P500 Emini intraday market update for price action day traders
Time of update 8:25 a.m. PST.
The bears triggered a double top major bear trend reversal above last week’s and last month’s high. Although the first 20 bars closed above the moving average, the rally was weak and was likely to part of a trading range and not a bull trend. However, the bears have not yet been able to generate a series of consecutive big bear trend bars. This means that the selling was weak. This increases the chances of a trading range.
Whenever there is a lot of trading range price action on the open, the odds of mostly trading price action for the rest of the day are high. If the Emini spends a lot of time in a tight trading range, it will be in breakout mode. Day traders will look to enter on a strong breakout, up or down, especially if there is a good follow-through bar. If there is no follow-through, day traders will bet that the breakout will fail and they will fade it (take a trade in the opposite direction). Many traders will simply bet against all breakouts up and down and buy low, sell, high, scale into both, and scalp. They will continue to do this until there is a strong breakout with follow-through.
The Emini opened above last month’s and last week’s high and reversed down. Last week’s high was also the all-time high. Since today is the first day of the week and month, the bears were selling, hoping to be shorting the high of the coming week and month. They knew that the probability was low, but so was the risk, and the reward was very big. This made the math work.
Thursday had a 60 minute moving average gap bar (a high below the moving average. This is usually the start of the final bull leg before there is a major trend reversal. If one forms during this current rally, traders will look for a pullback on the 60 minute chart that will last at least 10 bars and two legs.
S&P500 Emini monthly, weekly, and daily candle charts
The daily, weekly, and monthly Emini charts are all in strong bull trends, but overbought. However, the monthly chart is in a small pullback bull trend and therefore the downside is probably limited to 3 – 5 months. This can be a 100 – 200 point correction on the daily chart and it can begin any time, especially since all time frames are so overbought.
See the weekly update for a discussion of the weekly chart.
Traders can see the end of the day bar-by-bar price action report by signing up for free at BrooksPriceAction.com. I talk about the detailed Emini price action real-time throughout the day in the BrooksPriceAction.com trading room, and a 2 day free trial is available.
When I mention time, it is USA Pacific Standard Time (the Emini day session opens at 6:30 am PST, and closes at 1:15 pm PST). You can read background information on the intraday market reports on the Intraday Market Update page.


Great review, thanks.