S&P500 Emini outside down day
Updated 6:53 a.m.
The Emini gapped above the 60 minute moving average after yesterday’s double bottom higher low major trend reversal. Yet, it formed an early tight trading range, and it is above yesterday’s midpoint. This increases the chances of an early selloff.
Since yesterday was a big day and an outside day, today might be an inside day. Furthermore, the monthly resistance above is the open of the month. The monthly support below is last month’s low. Therefore there is an increased chance of a trading range day and an inside day. Unless there is a strong breakout beyond these levels, traders will look to fade tests up and down.
This limit order open also increases the odds of a trading range day. The ranges lately have been big enough for swings up and down, and today will probably have at least one of each. The odds are against a strong trend day today. Yet, traders should be ready for a trend at the end of the day that might move beyond either of the monthly targets.
Pre-Open Market Analysis
Yesterday had a strong bear breakout. Yet, the bulls rallied strongly from a Final Flag reversal, just above last month’s low. The reversal was strong enough so that the best the bears will probably get in the 1st 2 hours today is a trading range.
Monthly support and resistance
Today is the final trading day of the month. Therefore, monthly support and resistance are important. Especially relevant are last month’s low and this month’s open. While the Emini tried to hold at the open of the month for the past 2 days, the bulls failed. There was a strong bear breakout yesterday. Hence, the Emini decided instead to test support below.
Since last month was a sell signal bar, the Emini sold off to test its low. The bears want the Emini to close below last month’s low. Hence, they could argue that they have taken control. The bulls always want the opposite.
Because the Emini is now between the September open and the August low, it might go sideways here until the end of the day and then get drawn to one or the other.
Emini Globex session
The Emini is unchanged in the Globex market after trading down in the middle of the night. It has a double bottom with the September 27 low and a double top with the September 22 high. It is therefore in breakout mode.
Forex: Best trading strategies
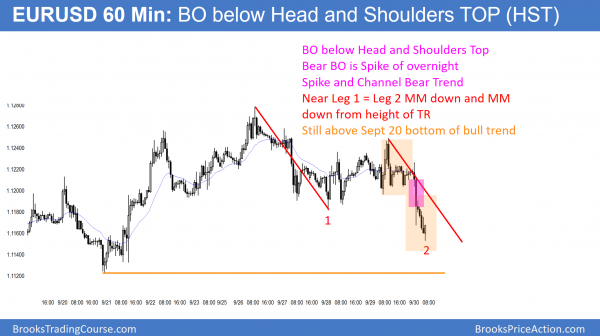
The 60 minute EURUSD Forex chart broke below the neck line of a Head and Shoulders top last night. Yet, it is still above the September 22 bull bottom. The bulls therefore see the selloff as simply a 2nd leg down in a trading range.
The daily EURUSD Forex chart is at the Apex of a tight 6 week triangle. Hence, it is in breakout mode. Because the triangle is about 200 pips tall, the odds are that the breakout will travel about 200 pips. Since the triangle is now very tight, the breakout will probably come within a week or two. When a market is in Breakout Mode, there is a 50% chance that the 1st breakout fails. Furthermore, there is a 50% chance that the final breakout will be up or down.
Overnight EURUSD Forex sessions
The 60 minute chart sold off in a Spike and Channel bear trend over the past 6 hours. Yet, it is down only 60 pips and still above the September 21 low. The bears need to break below that low to get out of the tight trading range. The bulls see the overnight selloff as simply the 2nd leg down from the September 26 high. It is also a higher low in the triangle that began on August 5.
Because the selloff has been strong and the bear channel is tight, the odds are that the best the bulls will get over the next couple of hours is a trading range. The 1st reversal up will probably be minor and bears will sell it. Yet, because the selling is a series of sell climaxes, it will probably not fall much further before bears begin to take profits. This will therefore create a trading range that will ast at least a couple of hours.
Summary of today’s S&P Emini futures price action and what to expect tomorrow
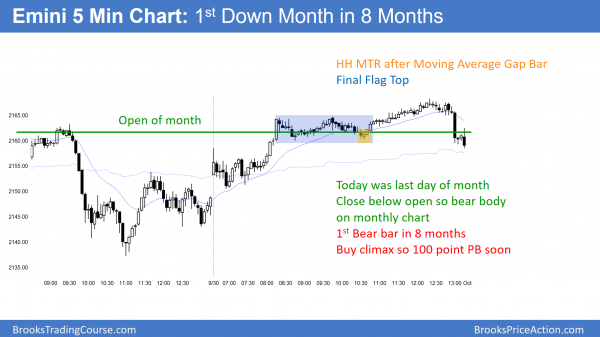
After a Final Flag Top and a higher high major trend reversal, the Emini closed below the open of the month.
Because today was the last day of the month and it closed below the open of the month, the monthly chart had a bear body for the 1st time in 8 months. In the 18 years of the Emini, every time there were 7 consecutive bull trend bars, the Emini sold off about 100 points soon after. The odds of a 100 point selloff in the next two months are therefore high. While the rally could continue indefinitely, the odds of much of a rally without the pullback are small.
See the weekly update for a discussion of the price action on the weekly candlestick chart and for what to expect going into next week.
Traders can see the end of the day bar-by-bar price action report by signing up for free at BrooksPriceAction.com. I talk about the detailed S&P Emini futures price action real-time throughout the day in the BrooksPriceAction.com trading room. We offer a 2 day free trial.
When I mention time, it is USA Pacific Standard Time (the Emini day session opens at 6:30 am PST, and closes at 1:15 pm PST). You can read background information on the intraday market reports on the Intraday Market Update page.


Hi Al,
I’m not sure what you did differently today with your microphone, but I just wanted to say that today’s summary was clear, and had no audio distractions from moving the microphone. It was much easier to understand you; for a struggling trader, it’s important that I hear you clearly. Thank you!
Also, hope your breathing gets better.
Thanks again!
Al, thank you for your support.
Hi AL,
EU has seen big spikes up and down over last couple of days. I managed to catch most of these (both buy and sell) but couldn’t pre-empt this bull breakout after reversal from 1.1153. Mainly because I was expecting another leg down to complete wedge or double bottom. Secondly I was only expecting retracement back to 1.1195/1.1190 top of bear channel
Was there any sign which could have helped to pre-empt this strong break up (even though still below the top of bear spike)?
Many Thanks