End of day comments about today’s Emini price action and day trading

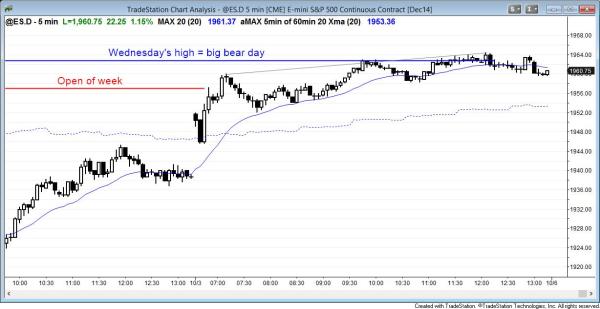
The Emini had an opening reversal up from a pullback to the 60 minute moving average and just above yesterday’s high. It closed near the open of the week and created a big doji candle on the weekly chart.
The Emini was overbought on the 60 minute chart coming into the day and became more so after a rally to the 60 minute bear trend line. However, it ended up as a spike and channel bull trend day. It closed above the open of the week, but the body was small and this created a doji candle, despite the bull body. It failed to close above the top of the big bear trend day (Wednesday), and this is a sign of a lack of strength for the bulls. The 5 minute and 60 minute charts are overbought and they should pullback early next week for at least a day or two.
S&P500 Emini intraday market update for price action day traders: bear rally for day traders
Posted 7:32 a.m.
The Emini is in a bear rally for day traders on the 5 minute chart. It had a parabolic wedge top at 7:05 a.m. and this is a possible high of the day, although there is still a trend line magnet above.
The Emini reversed up sharply yesterday and gapped above yesterday’s high. It also rallied above the bottom of the breakout point from the bear breakout 2 days ago. I expected this because I think that the daily chart is in a 4 month trading range and the Emini usually goes above resistance, like the breakout point, and below support, before reversing.
The rally on the open has had several bear bars following bull bars and the Emini has rallied for many bars without much of a pullback. The weak follow-through after the series of bull breakouts in an overbought market increases the chances that the Emini will soon enter a trading range. Although the open is bullish, the Emini is overbought.
The 60 minute chart has had a rally above the moving average in a strong bear, but it has not yet had a major trend reversal. This limits the upside potential until a higher low forms. To get a higher low, the 60 minute chart needs a pullback, which is likely today.
IF there is a strong breakout in either direction, especially if there is strong follow-through, day traders will be more inclined to swing positions. As long as the current trading range behavior continues, they will buy low, sell high, and scalp.
Before the open comments on S&P500 Emini 60 minute, daily, weekly, and monthly candle charts
Today is a Friday so day traders will pay attention to support and resistance on the weekly chart as well as the daily. The weekly moving average is around 1940, the open of the week is 1957.00, and the low was yesterday’s low of 1918.25. If the market is near any of these prices at the end of the day, it might be drawn to the price.
The bears want a bear body on the weekly chart, which means that they want today’s close to be below Monday’s open of 1957.00. They prefer that the day closes on its low so that the weekly candle will be a big bear trend bar with a close on its low and below the moving average. The bulls always want the opposite. At a minimum, they want a close at or above the moving average, and no bear body, but prefer a close on the high of the bar, which would be a bull reversal bar at the moving average.
See the weekly update for a discussion of the weekly chart.
Traders can see the end of the day bar-by-bar price action report by signing up for free at BrooksPriceAction.com. I talk about the detailed Emini price action real-time throughout the day in the BrooksPriceAction.com trading room, and a 2 day free trial is available.
When I mention time, it is USA Pacific Standard Time (the Emini day session opens at 6:30 am PST, and closes at 1:15 pm PST). You can read background information on the intraday market reports on the Intraday Market Update page.

