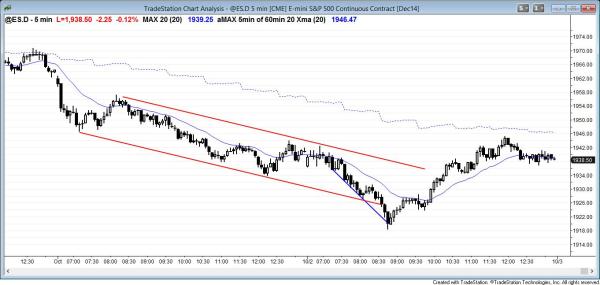
End of day comments about today’s Emini price action and day trading

The Emini had follow-through selling today, but reversed up after a parabolic wedge sell climax. The odds were high that yesterday’s bear channel would be a bull flag and that today would rally at some point for at least 20 bars. The bears got a bear breakout below the bear channel, but like most bear breakouts below bear channels, it failed and the Emini reversed up. The day ended up as a doji candle on the daily chart. Although it was a reversal day, it was also a big trading day.
The Emini sold off strongly in a sell climax to below the 60 minute measured move target for the head and shoulder top. It then rallied from that sell climax and from a parabolic wedge bottom back up to yesterday’s close. This created a doji candle on the daily chart. This bad follow-through is price action that is more consistent with a trading range on the daily chart. The 2 week selloff is probably part of a 4 month trading range rather than a new bear trend.
S&P500 Emini intraday market update for price action day traders
Posted 7:20 a.m. PST.
Day traders are expecting more of a trading range day after yesterday’s sell climax, but they will be ready for a trend in either direction. The Emini yesterday was in a bear channel, which is a bull flag. This usually results in a two legged rally at some point on the next day. Since the channel lasted a long time, the two legs sideways to up today might be about 10 bars on the 15 minute chart, rather than only on the 5 minute chart.
Instead of simply going up from a higher low major trend reversal, the Emini might first have a bear breakout and then a reversal up for a bull swing. Less likely, there will be strong follow-through selling and a strong bear trend day. As always, if there is a strong breakout up or down and good follow-through, traders should look to trade in that direction.
Before the open comments on S&P500 Emini 60 minute, daily, weekly, and monthly candle charts
The daily Emini chart was in a bull flag until yesterday when it had a strong bear breakout below the bull flag. This usually results in a measured move down, which would lead to a drop to around 1900. Since it looks like the Emini has been in a trading range on the daily chart since the beginning of June, it is likely that the market will test the bottom of the range, which is the August low, just below 1900. I have been talking about this 1900 target for a couple of months.
Yesterday will probably become a measuring gap, which means that the Emini will probably reach the measured move target below 1900 before it rallies above the breakout point (Thursday’s low of 1955.50). However, since the Emini is in a trading range, it will probably have a lot of trading range price action. For example, trading ranges repeatedly disappoint traders. The bulls were disappointed by the bear breakout of the bull flag. The bears will be disappointed if today does not have a bear body on the daily chart. They want that bear close to confirm yesterday’s bear breakout. The bulls want a reversal back up into the bull flag and for this bear breakout to fail. Until the bulls begin to lift the market above prior lower highs, the bears will remain in control.
Because I believe that the selloff is probably a bear leg in a 4 month trading range, I think that the follow-through will be disappointing for the bears. An obvious source of disappointment would be a bull candle today, signifying a lack of follow-through and reducing the chances of a bear trend. On the other hand, if today is a big bear candle of the daily chart, this would increase the chances of a drop well below the 1900 bottom of the trading range.
See the weekly update for a discussion of the weekly chart.
Traders can see the end of the day bar-by-bar price action report by signing up for free at BrooksPriceAction.com. I talk about the detailed Emini price action real-time throughout the day in the BrooksPriceAction.com trading room, and a 2 day free trial is available.
When I mention time, it is USA Pacific Standard Time (the Emini day session opens at 6:30 am PST, and closes at 1:15 pm PST). You can read background information on the intraday market reports on the Intraday Market Update page.


The pre-market review is great! Thanks, Al.