End of day comments about today’s Emini price action and day trading

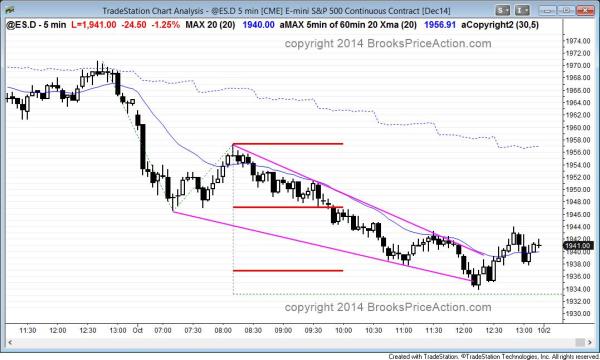
The Emini sold off sharply on the open and triggered a sell signal on the monthly chart by falling below last month’s low.
The Emini triggered a monthly sell signal when it fell below last month’s low. Although it rallied sharply and formed a moving average gap bar at 8:10, the selloff did not lead to a major trend reversal. Instead, it was followed by a measured move down. After a wedge bottom at 12:15, there was profit-taking into the close.
The daily chart had been trying to form a bull flag over the past few weeks and today broke strongly below that bull flag. The Emini will probably fall for a measured move down, which is around the 1900 target that I have mentioned many times.
S&P500 Emini intraday market update for price action day traders: bear trend for day traders
Posted today at 7:25 a.m. PST.
The Emini sold off on the open below last month’s low and it closed the August gap on the daily chart, creating a bear trend for day traders. The initial bear trend fell for about 17 points, which makes a bull trend day extremely unlikely. The day will probably be a bear trend day or a trading range day. If it becomes a trading range day, it could rally 10 points or more since the initial selloff was so big.
The Emini fell below the gap on the daily chart and below last month’s low, which triggered a second entry short on the monthly chart. It bounced at a measured move down from yesterday’s 5 minute head and shoulders top bear flag and from a bear trend channel line. Today could become a huge bear trend day and not reach the moving average all day.
More likely, the selloff was a sell vacuum test of support and the market will enter a trading range. Then, it will decide between trend resumption down and trend reversal up. Until there is a clear major trend reversal or a strong bull breakout, traders should focus on selling rallies. The bars and legs are big. This means that stops are far away and traders should trade small.
Before the open comments on S&P500 Emini 60 minute, daily, weekly, and monthly candle charts
The monthly candle closed yesterday and it formed a bear reversal bar. This is a sell signal bar, and it is the second signal (July was the first). Bears trading the monthly chart will short 1 tick below last month’s low, looking for a test of the moving average, which currently is below 1800.
The weekly chart triggered second entry short last week, but the entry bar was weak because it had a big tail below.
The daily Emini has been in a trading range for over a month. The bears hope that the higher high major trend reversal of 2 weeks ago leads to a test of the bottom of the range around 1900. They do not mind if the Emini rallies to test the September 24 lower high as long as the rally forms a double top with that high. They then want a strong breakout below the neck line of that double top, which is Monday’s low. If the Emini does test that high and then turn down, that rally would be a lower high major trend reversal (the right shoulder of a head and shoulders top). Most tops fail, but this one is occurring when the monthly chart is exceptionally overbought. This increases the probability of a correction.
See the weekly update for a discussion of the weekly chart.
Traders can see the end of the day bar-by-bar price action report by signing up for free at BrooksPriceAction.com. I talk about the detailed Emini price action real-time throughout the day in the BrooksPriceAction.com trading room, and a 2 day free trial is available.
When I mention time, it is USA Pacific Standard Time (the Emini day session opens at 6:30 am PST, and closes at 1:15 pm PST). You can read background information on the intraday market reports on the Intraday Market Update page.

