S&P500 Emini head and shoulders top, but most tops fail
Updated 6:54 a.m.
While the Emini opened with strong bear bars and a breakout below yesterday’s double top, many days over the past 6 weeks have had similar opens that led to Opening Reversals. The bears want a close below last week’s low. Hence, this week would be an outside down week. It would therefore increase the probability that the 50 – 100 point pullback has begun.
The bulls want a close above the open of the week. That would create the 8th consecutive bull trend bar on the weekly chart, which would be unusual. The odds are, especially with this bear open, that today will close below the open of the week. Therefore, the weekly candlestick pattern will have a bear body.
At the moment, the Emini is Always In Short. Yet, most days over the past 6 weeks have gone sideways for the 1st hour or two. With the early Micro Double Bottom and 2 big bull bars, that is likely today. The bulls want an early low of the day. Yet, the selling has been strong enough to that the bulls will probably only get a trading range. After the trading range, the Emini will decide between a swing up and follow-through selling. With the Emini closer to last week’s low than last week’s open, and the momentum down, the odds favor trend resumption down.
Pre-Open Market Analysis
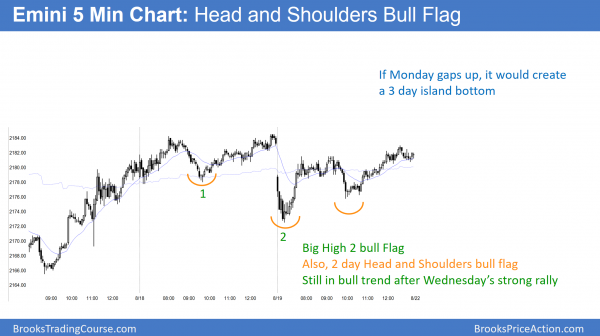
The Emini formed a one day island top on Monday. Yet, yesterday rallied to exactly Monday’s low. It could not close the gap. The bulls are still hoping for a test of the 2200 – 2220 resistance. Because the daily chart is in a strong bull trend, the odds are that they will be successful. Because Monday was an island top, there is an increased chance of a gap up today. It would therefore create a 3 day island bottom.
However, the monthly, weekly, daily, and 60 minute charts are all beginning to form topping patterns. Also, the weekly and monthly charts both have 7 consecutive bull trend bars. That is unusual and therefore unsustainable. Hence, it is a type of buy climax. The odds are that the bears will get a 50 – 100 point pullback from these tops. However, there will probably be one more new high before the pullback begins.
Yet, the bull trend is so strong that bulls will buy the selloff. It will therefore more likely be a bull flag than a bear trend reversal.
Weekly support and resistance on Fridays
Because today is Friday, it determines the appearance of the bar on the weekly chart. Yesterday rallied to within 1 tick of the open of the week. The bulls want a bull trend bar on the weekly chart. They therefore want today to close above Monday’s open. This would create the 8 consecutive bull trend bar on the weekly chart. The odds are that today will close below the open of the week and create a bear body.
If the bulls succeed, there would then be 8 consecutive bull trend bars on the weekly chart. While its been years since I tested this, the odds are probably 80% that 9th week would have a bear body.
Head and Shoulders Top on the 60 minute chart
Only 40% of Major Trend Reversals result is a profitable swing trade. While it is possible that the current 60 minute Lower High Major Trend Reversal (also a Head and Shoulders Top) will lead to the 50 – 100 point correction that is likely over the next few weeks, it is more likely that it will be a bull flag. As a result, the probability of at least one more new high is greater than that for a reversal down.
Emini Globex session
The bulls yesterday were unable to close the gap below Monday’s island top, which is good for the bears. Yet, the overnight selloff found support at yesterday’s higher low. The bears see the selloff as the start of a bear trend after a Head and Shoulders Top on the 240 minute Globex chart. The bulls look at the same chart and see a double bottom bull flag. They are both right. Because the Emini has been in a tight trading range for 10 days, the probability for the bulls and bears is about the same. The 240 minute and daily charts are in Breakout Mode.
While the bears have an island top on the daily chart, they do not yet have a strong bear breakout. Because the top is in a bull trend and most tops fail, the bulls still have a higher probability of higher prices, even if there is a bear breakout first. Yet, because of the nested tops and buy climaxes on the weekly and monthly chart, the odds favor a selloff soon, whether or not there is a new high first.
Forex: Best trading strategies
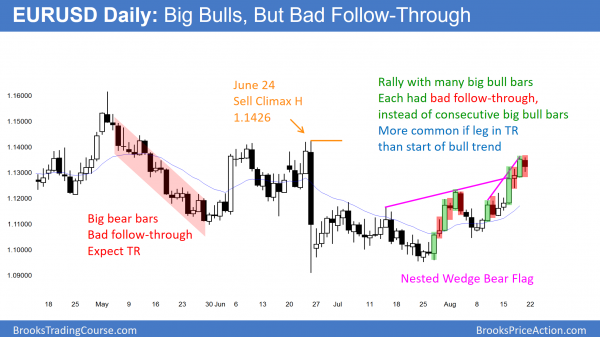
The EURUSD daily Forex chart has been in a bull trend for a month. Yet, instead of consecutive big bull trend bars, each big bull bar is followed by a pause bar. This is more common if the rally is part of a trading range. The bears had a similar trend in May where the follow-through bars were bad, and the trend then evolved into a trading range in June.
The current rally is a Nested Wedge Bear Flag. However, because it is in a trading range, the probability for a bear breakout is less than the usual 60%. There is about a 45% chance of a bull breakout that would lead to a Measured Move up.
The EURUSD daily Forex chart had bull trend resumption yesterday after Monday’s bull breakout. While the minimum objective was at least one bar up after Wednesday’s pullback, the rally as at least a 50% chance of testing the top of the 1.1426 June 24 sell climax high.
Because the rally on the 60 and 250 minute charts has a series of buy climaxes, there is a chance of a reversal at any time. Yet, there is no top at the moment and the momentum favors at least a little more up.
Overnight EURUSD Forex sessions
While the EURUSD Forex market sold off overnight, the selloff on the 60 minute chart was mostly made of small bars with prominent tails. It was not a strong bear breakout. As a result, it will probably be the start of a trading range. Once the trading range is clear, bulls will see it as a bull flag. Furthermore, bears will see it as a topping pattern. Because the 60 minute chart is still in a bull trend, the bulls have a higher probability.
Furthermore, the June 24 sell climax high on the daily chart is still a magnet that is pulling the market up. Finally, after 5 consecutive bull bars and a 9 day rally with only 1 bear bar, the odds are that bulls will buy the 1st pullback. The bears usually need at least a Micro Double Top before they can create a swing down.
The 5 minute chart has been in a 30 pip tall trading range for 6 hours. There is no sign that it is about to end. Hence, day traders are scalping while waiting for the breakout.
Summary of today’s S&P Emini futures price action and what to expect tomorrow
The Emini is still rallying after Wednesday’s bottom. There is now a Head and Shoulders Bull Flag.
…
See the weekly update for a discussion of the price action on the weekly candlestick chart and for what to expect going into next week.
Traders can see the end of the day bar-by-bar price action report by signing up for free at BrooksPriceAction.com. I talk about the detailed S&P Emini futures price action real-time throughout the day in the BrooksPriceAction.com trading room. We offer a 2 day free trial.
When I mention time, it is USA Pacific Standard Time (the Emini day session opens at 6:30 am PST, and closes at 1:15 pm PST). You can read background information on the intraday market reports on the Intraday Market Update page.


