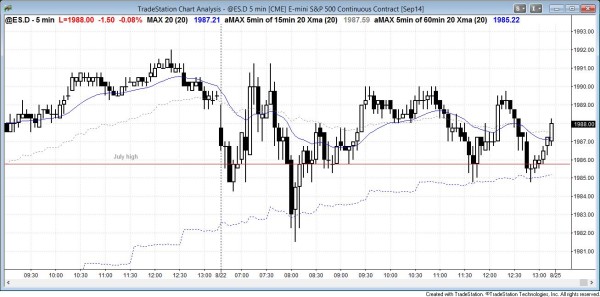
I posted this chart after the close. The S&P500 Emini had trading range price action from the open. There were two legged moves up and down all day.
End of day comments about today’s Emini price action and day trading
The S&P500 Emini sold off to the 60 minute moving average, which it has not touched in four days, and found buyers. It reversed up, but remained in a trading range all day. It could not escape the magnetic pull of the open of the day and of the July high. The weekly candle closed with today’s close, and it closed above the July high. This is a gap and a sign of strength for the bulls. However, the stock market is overbought on all time frames and will likely pull back soon.
S&P500 Emini intraday market update for price action day traders
Time of update 8:37 a.m. PST.
Fed Chairwoman Yellen spoke at 7 a.m. and her speech had the potential to create a big move up, down, or both. Her speech was followed by trading range price action. Since the Emini is so overbought on the 5 and 60 minute charts, the odds favored a trend reversal down even if there was first a strong rally. The S&P500 Emini went sideways after her speech and most day traders waited for clarity. Although at 8 a.m. there was a strong bear breakout below the low of the day, yesterday’s low, and the 60 minute moving average, the Emini reversed up strongly enough to erase much of that bear selling pressure and make the stock market almost neutral.
At this point, the Emini is in the middle of its range on a day with many reversals. It is a trading range day. After 4 consecutive bull trend days and a breakout above the all-time high, the Emini might end up forming a doji bar on the daily chart, which means that the trading range price action might continue all day and the day might close in the middle of the range near the open of the day. Both the bulls and bears have had breakouts, but neither has had follow-through. Both were disappointed, and disappointment is one of the hallmarks of a trading range day. Until there is a breakout with strong follow-through, the day will continue as a trading range. If the Emini is within 4 points or so of the open of the day after 11 a.m., the magnet of the open of the day might pull the market there to create a doji bar on the daily chart.
Since today is a Friday, the weekly candle will be important. The most important price is the July high at 1985.75, which is near the open of the day, and it will also be a magnet at the end of the day.
S&P500 Emini monthly and weekly candle charts
The S&P500 Emini formed an outside up bar on the monthly chart. The bar closes next Friday on the last day of the month. The bulls want next Friday to close above the July high, creating a gap, which they hope would become a measuring gap. This is an obvious sign of strength. The bears want the opposite. They want the August close to be below the July high, and they want as big a tail as possible on the top of the August bar. This fight between the bulls and the bears means that July’s high will be a magnet going into the close of the month next Friday.
There is a seasonal bullish tendency from August 30 to September 5. This implies that the stock market does not begin to rally on the days before, and often sells off during those days. Since the S&P500 is overbought and the July high is an important price, it could sell off 20 or more points over the next few days, and then begin to rally again late next week.
The weekly S&P500 attempted to form a higher high major trend reversal in March. Instead, the stock market broke to the upside. When the market attempts to top and then has a strong bull breakout, that breakout usually is followed by a second leg up. The Emini reversed down in July and has since rallied to a new high. This is the second leg up. Although there is no sign of a top at the moment, this is a potential low 4 setup (a low 2 failed, and it soon might form a second low 2).
Most tops fail. However, all reversals occur at resistance and come from credible tops, so traders have to be aware of those tops. As a top develops, traders assess its strength and place bets on whether it looks like it will fail or succeed. There is no top yet on the weekly chart, but because the stock market is forming a potential low 4 at the top of the weekly channel when the monthly chart is so overbought, traders will look for a sell signal soon.
See the weekly update for a discussion of the weekly chart.
Traders can see the end of the day bar-by-bar price action report by signing up for free at BrooksPriceAction.com. I talk about the detailed Emini price action real-time throughout the day in the BrooksPriceAction.com trading room, and a 2 day free trial is available.
When I mention time, it is USA Pacific Standard Time (the Emini day session opens at 6:30 am PST, and closes at 1:15 pm PST). You can read background information on the intraday market reports on the Intraday Market Update page.

