Premarket price action analysis
For tomorrow’s analysis, wait until after today’s close. Then, look at the bottom of this post for “Outlook for tomorrow’s Emini price action and day trading.”
If you want to see today’s premarket analysis, I posted it after yesterday’s close in yesterday’s blog at S&P500 Emini intraday market update.
S&P500 Emini intraday market update for price action day traders: big gap up and test of resistance
Posted 7:20 a.m.
The Emini had a big gap up and test of resistance. Although the Emini had a big gap up and it tested the October low, most of the bars had tails and there were no consecutive strong bull trend bars. This is trading range price action and it is a sign that the Emini might have a lot of trading range price action today, probably around the October 8 low and the moving average. Traders are waiting for a strong breakout up or down, but the odds right now favor a trading range day. The Emini is currently in its 3rd small push up and this could lead to a parabolic wedge top at resistance. The bulls are hoping for a strong breakout and measured move up.
The Emini had a bull breakout above a 60 minute bear flag yesterday and gapped up today. The most important price is the October 8 low of 1918, which is the double bottom. When the Emini fell below it, it fell in a parabolic sell climax, which means that the double bottom was important support. It is now the breakout test area. The Emini tested it, but it will probably pull back at least some. It is possible that it forms the high of the day there. However, if the Emini breaks strongly above it, it will become support.
Measured move projections based on that bear flag are 1908, 1921 (above the October 8 double bottom), and 1970 (around the lower high that is the neckline of that double bottom). There is also a bear trendline around 1930. Yesterday’s high of 1900.50 is support below.
When there is a big gap up, the Emini is far above the moving average. This usually limits the upside for the first hour. The Emini often pulls back near the moving average, often in a high 2 buy setup or a wedge bull flag. This is often the low of the day. It can pull back one more time and form a double bottom before rallying.
The bears want the gap up to fail and they like to see a series of big bear trend bars closing on their lows, setting up a possible bear reversal and a trend from the open bear trend day.
Whether the bulls or bears prevail initially, the odds favor a swing trade when there is a big gap. Traders will look for a breakout up or down with follow-through. If they see one, they will enter in the direction of the trend and use an appropriate stop (for example, if there is a pullback and then a bull breakout, the bulls will put the stop below the bottom of the breakout). The minimum goal for swing traders will be 4 points and they will try for more if the trend is strong and there is a measured move projection that is more than 4 points away.
Outlook for tomorrow’s Emini price action and day trading

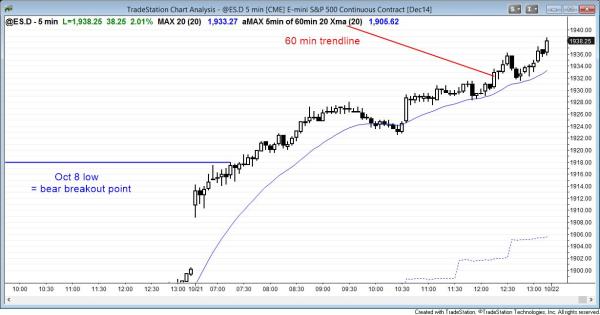
The Emini had a strong small pullback bull trend day. The next resistance is the October 8 high. The Emini is very overbought on the 5 minute chart and might have a pullback first.
The Emini had a big gap up this morning and the day became a trend from the open bull trend. The rally for the first hour had many small bars with prominent tails, but there were no pullbacks. After the 7:45 a.m. bull breakout, day traders saw the day as a small pullback bull trend day, which is the strongest type of bull trend.
There finally was a pullback to the moving average around 10:00 a.m. and the bears tried to create an endless pullback but the bulls soon were able to create a strong breakout at 10:35, which controlled the price action for the rest of the day.
The 60 minute chart is extremely overbought and will likely have a 10+ point pullback tomorrow or Thursday, but this reversal up has been so strong that the rally will probably test the October 6 and 8 high around 1970 after a probably pullback within a day or two.
The reversal up has been strong enough to erase the bear case and the Emini is now back in a trading range. The current leg up is strong enough so that any pullback will probably be bought and that buying will create a second leg up. However, the stock market is still in a trading range, as it has been all year, and until there is a clear breakout up or down, it will probably stay in a trading range for the rest of the year. The legs on the daily chart are big and the current one is strong, but it is still within a year long trading range.
See the weekly update for a discussion of the weekly chart.
Traders can see the end of the day bar-by-bar price action report by signing up for free at BrooksPriceAction.com. I talk about the detailed Emini price action real-time throughout the day in the BrooksPriceAction.com trading room, and a 2 day free trial is available.
When I mention time, it is USA Pacific Standard Time (the Emini day session opens at 6:30 am PST, and closes at 1:15 pm PST). You can read background information on the intraday market reports on the Intraday Market Update page.

