End of day comments about today’s Emini price action and day trading

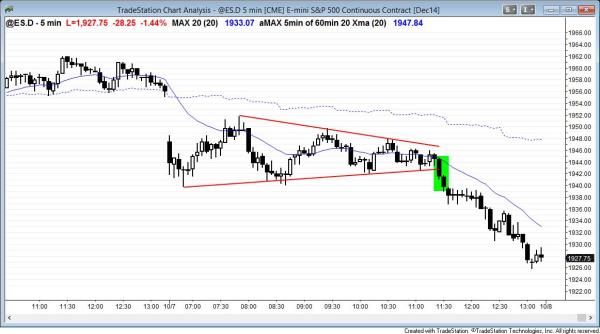
The Emini had trading range price action and spent 5 hours in a triangle. There was a late bear breakout for resumption of the bear trend.
As soon as a trading range has 3 pushes up or down, it is a triangle. The Emini technically became a triangle on the third push down to 10:10 a.m., but it clearly was in a trading range from the open or from the 8 a.m. bear reversal.
The 60 minute bulls had their higher low major trend reversal at 6:50 a.m. and then again with the double bottom at 8:30 a.m., but the price action was sideways instead of up. The triangle broke to the downside at 11:20 a.m. for a swing down, creating a trend resumption bear trend day.
S&P500 Emini intraday market update for price action day traders: breakout mode for day traders
Posted 7:28 a.m. PST.
The day began in breakout mode for day traders. The Emini gapped down today, but reversed up at a leg 1 = leg 2 measured move target. This was a 60 minute higher low major trend reversal. On the 5 minute chart, it was also the second entry buy on a reversal up from below yesterday’s low. The initial rally on the 5 minute chart had consecutive bull trend bars, but they were not very big and the follow-through on the next bar was weak. This increased the chances of a pullback and then a trading range. The bears saw the rally as a double top with the high of the day, and it was below the moving average. This was a possible high of the day. They want a breakout below the low of the day and a measured move down. The bulls want a breakout above the double top and then a measured move up.
This is a breakout mode setup. Traders can be long or short before the breakout. However, the probability of a profitable swing trade is higher after a strong breakout up or down. If the breakout is weak, traders will look to fade it.The context is good for the bulls since this is a pullback after a strong reversal last week. However, traders always need to be aware that the opposite of what is likely will happen about 40% of the time.
Before the open comments on S&P500 Emini 60 minute, daily, weekly, and monthly candle charts
The Emini pulled back yesterday after a strong reversal up from a higher low on the 60 minute chart. The bears see the pullback as a bear breakout from a double top with June 30. The bulls see the reversal up as strong enough so that it will have a second leg up. At the moment, the bull case is stronger. Whether or not the bulls get their second leg, I still think the odds favor a bigger second leg down to below 1900.
See the weekly update for a discussion of the weekly chart.
Traders can see the end of the day bar-by-bar price action report by signing up for free at BrooksPriceAction.com. I talk about the detailed Emini price action real-time throughout the day in the BrooksPriceAction.com trading room, and a 2 day free trial is available.
When I mention time, it is USA Pacific Standard Time (the Emini day session opens at 6:30 am PST, and closes at 1:15 pm PST). You can read background information on the intraday market reports on the Intraday Market Update page.

