End of day comments about today’s Emini price action and day trading

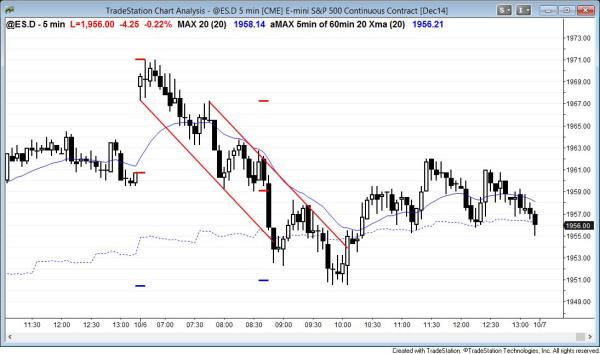
The Emini sold off from above yesterday’s high and reversed up at a measured move down from today’s high to yesterday’s close. Day traders bought the lower low major trend reversal.
The Emini had 4 consecutive bear bars after the high of the day and that was the start of a bear trend. The Emini reversed up exactly at a measured move down from the high of today to yesterday’s close, and that meant that the computers were paying attention to yesterday’s close. This made a test of yesterday’s close likely. The bottom was a lower low major trend reversal, and it led to a swing up. The bear trend evolved into a big trading range, which is what usually happens.
The Emini traded up for two legs to test yesterday’s close, and then the Emini entered a tight trading range. Even though the second leg up to 11:25 was strong, the odds favored a trading range after a big selloff. A second leg up often is strong like this, but the lacks follow-through, unlike on a trend day where traders buy a pullback and look for a third or fourth leg up.
S&P500 Emini intraday market update for price action day traders: bear rally for day traders
Posted 7:33 a.m.
The Emini had a bear trend channel after a gap up on the open and a brief tight trading range. The tight trading range might be a sign that today will have mostly trading range price action, especially since the stock market is late in a 5 minute bull channel. The breakout above yesterday’s high failed and the Emini entered a bear microchannel. However, it failed to keep gaps open on the way down. This increases the chances that the selloff will become a bear leg in a trading range. Also, the channel up is tight enough so that the downside will probably be limited because 60 minute traders will buy, hoping for a higher low major trend reversal.
At the moment, day traders see the Emini as always in short. The selling is strong enough so that the first rally will probably be sold and it will create a lower high major trend reversal. However, because the 60 minute reversal up was so strong, today will probably not become a big bear trend day. Instead, it probably will have a lot of trading range price action after the 2nd leg down on the 5 minute chart. Less likely, it will be a strong bear trend day. After the 9 bar bear microchannel, a bull trend day is unlikely.
Before the open comments on S&P500 Emini 60 minute, daily, weekly, and monthly candle charts
The reversal up last week was so strong that the Emini will likely have a 2nd leg up after any pullback. The 60 minute chart probably will pull back to around the moving average or the 1950 breakout point area and then try to form a lower high major trend reversal. However, just like the upside breakout of the 4 month trading range failed in mid-September and the downside breakout failed last week, the odds of a successful upside breakout on this leg up are also small. Because the monthly chart is so overbought, the odds favor more sideways to down until the Emini tests the monthly moving average.
See the weekly update for a discussion of the weekly chart.
Traders can see the end of the day bar-by-bar price action report by signing up for free at BrooksPriceAction.com. I talk about the detailed Emini price action real-time throughout the day in the BrooksPriceAction.com trading room, and a 2 day free trial is available.
When I mention time, it is USA Pacific Standard Time (the Emini day session opens at 6:30 am PST, and closes at 1:15 pm PST). You can read background information on the intraday market reports on the Intraday Market Update page.


Thanks bigbeaver.
There seems to be a plugin conflict that is now fixed.
All back to normal now.
The article does not show up properly today.
Warning: Invalid argument supplied for foreach() in /home/brookstc/public_html/wp-content/plugins/edd-content-restriction/includes/functions.php on line 52
This content is restricted to buyers of .