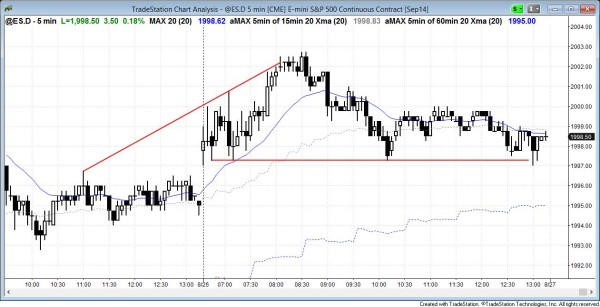
Like most days for the past several weeks, the S&P500 Emini’s price action today was that of a quiet trading range day. However, it broke above 2,000, which became a magnet for the rest of the day. There were few opportunities for online day trading, and beginner day traders had to be careful. Experienced traders used limit orders for scalps, but even they do not make much money on days like this.
End of day comments about today’s Emini price action and day trading
The S&P500 Emini finally broke above 2,000. This round number is a psychological resistance level and therefore not very important. It is more symbolic. However, because the Emini is so overbought on all time-frames and at some targets, the stock market could pull back at any time.
Friday is the last trading day of the month so its close determines the appearance of the bar on the monthly chart. There are two obvious targets. First, and more important, is the July high. The bulls want an outside up month, which means a close above the July high. The bears want to deny the bulls this sign of strength. However, when a sign of strength forms this late in a bull trend, it is often part of an exhaustive buy climax topping process. The second, less important magnet is 2,000.
S&P500 Emini intraday market update for price action day traders
Time of update 8:04 a.m. PST.
There was a bull breakout above resistance (the opening range) at 7:50 a.m. with a little follow-through, but the breakout bar had a tail and the follow-through bar was only an inside bar. Even though this makes a measured move up likely, it is a weak breakout and it is happening on a day where there is a lot of trading range price action. Also, the 5 minute chart is overbought and the weekly chart is at the top of a channel. All of these factors reduce the probability of a big bull trend day. Unless the bulls can begin to create consecutive, big bull trend bars, this will probably be a broad bull channel or a trending trading range day.
Because the 5 minute chart is so overbought and at resistance, and the breakout is weak, it can fail at any time and reverse down. The bears need either a strong top, like a major trend reversal, or a strong bear breakout. Without these, the bulls will remain in control.
The S&P500 Emini began with trading range price action, testing yesterday’s high and the 2,000 psychological resistance level. The 5 minute chart is overbought, and bearish day traders have been looking for a reliable sell setup, but the bull day traders have continued to reverse the market up from every top attempt.
Many days in the past three weeks have have protracted tight trading ranges, and today’s open was another example. The Emini will soon change into big swings because once all of the computer algorithms have all switched to the current price action, there will not be enough institutions to take the other side and the current limit order type of price action will no longer be profitable. The Emini will be in a stop order type of market and it will have big swings. However, this has not yet happened, and day traders have to trade the current price action and not the one that they know will soon appear.
Price action on the S&P500 Emini monthly and weekly candle charts
Nothing has changed from the updates from yesterday or the weekend. Both are in strong bull trends and the downside is probably limited. Because the monthly chart has climactic price action, it probably will soon correct for several months. This could put the daily chart in a bear trend during those months.
The daily chart has been in a very tight channel for three weeks. When the strongest part of the trend occurs late in a trend, it is often setting up a climactic reversal. Traders should be prepared for a possible big, brief upside breakout that reverses and begins a correction.
Traders can see the end of the day bar-by-bar price action report by signing up for free at BrooksPriceAction.com. I talk about the detailed Emini price action real-time throughout the day in the BrooksPriceAction.com trading room, and a 2 day free trial is available.
When I mention time, it is USA Pacific Standard Time (the Emini day session opens at 6:30 am PST, and closes at 1:15 pm PST). You can read background information on the intraday market reports on the Intraday Market Update page.

