Price action trading strategies after the unemployment report: Update 6:51 a.m.
The Emini opened with a big gap up but the 1st bar was a big bear bar. Furthermore, the next two bars had tails. The Emini is Always In Long and in a Trend From The Open bull trend, and there are magnets above. However, these 1st 3 bars reduce the chances of a strong bull trend day. The context is good for the bulls because the Emini is near its all-time high. If it can break out to a new all-time high today above 2110.75, it could quickly turn into a strong bull trend day. It could accelerate up as the cash index approaches it all-time high, which is 19 points higher.
The bears want the bull breakout to fail, like yesterday’s early rally failed. When there is a Buy The Close open like this, bulls will buy the 1st reversal. The bears usually need at least a micro double top if they are going to create an early high of the day. Alternatively, they will try for a parabolic wedge top.
At the moment, the Emini is long and the 1st reversal down will probably be bought. As with all big gap up days that rally, the odds favor an early trading range that lasts 1 – 2 hours.
Price action trading strategies after the unemployment report
S&P 500 Emini: Pre-Open Market Analysis
The Emini has been in a trading range for a week after last week’s buy climax. There is a 60% chance of the cash index rallying up to its all-time high from a year ago. If it does, the Emini will go above its all-time high from last month. However, there is only a 40% chance of a strong breakout. The odds are that the breakout will be limited and lead to a reversal back into the range.
The market was neutral at the end of yesterday coming into today’s unemployment report. Despite a big gap up or down, day traders are going to watch the 1st several bars for signs of what the day will become. Therefore, if they see a several reversals, prominent tails, and a lack of consecutive strong trend bars, the odds will favor a trading range day. Swing traders want to see consecutive strong trend bars. They want as many in a row as possible, and they want them to be big and have strong closes. They do not care if a trend is up or down. They simply want a trend so that they can swing trade.
Globex Emini after the Unemployment Report
The Emini is up 15 points after the report, just above the June 23 lower high. Therefore, it will probably gap up today. The bulls hope that yesterday was the 2nd leg down after the buy climax on the 60 minute chart. Yet, it is still possible that this move above the June 23 buy climax high is still part of the pullback from that high. The bulls need a strong trend day today to convince traders that the bull flag lasted only 3 days, and that the bull trend is resuming. They see last week as a strong bull trend and the past 3 days as a bull flag.
As with any gap up day, day traders will look for a trend up or down. With the momentum up strongly last week and the magnet above on the cash index, the odds favor the bulls. If there is a trend day today, it will more likely be up. Yet, there is still at least a 40% chance that it will be down. There is about a 50% chance that today will be mostly a trading range day.
If there is an early trend, traders will watch to see if traders are making money by taking positions against the trend, entering with limit orders. If those traders begin to consistently make money, the odds are that a trading will soon follow.
Increased chance of trend day up or down
Because traders know that there is an increased chance of a trend, they will look to enter early. If there is a rally on the open, the Emini will be far above its average price. This usually limits the rally to about an hour. If there is an early rally, the Emini then usually enters a trading range for 1 – 2 hours until it gets closer to the average price. The moving average would be rising steeply, and it usually gets near the Emini after a couple of hours.
At that point, day traders will decide between trend resumption up and trend reversal down. Since the trading range would be following a strong bull trend, the odds favor a 2nd leg up. If the trading range grows beyond 20 bars, the probability for the bulls begins to decrease. At some point, it falls to 50% and the Emini would be in breakout mode.
Weekly chart
The weekly chart closes today. Yesterday went above last week’s high and therefore triggered a buy signal. Because last week was a big buy signal bar, the stop was far. As a result of its high being at the top of the 4 month trading range, the probability was low for stop entry bulls. It therefore was no surprise that there were more sellers than buyers above last week’s high.
The bulls want today to go above last week’s high again to trigger the buy again. They also want today to close above last week’s high as a sign of strength. This week’s high and low are also magnets.
Forex: Best trading strategies
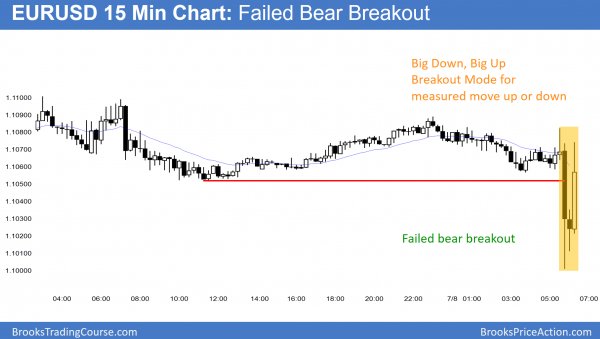
The bear breakout failed and there is now a Big Down, Big Up candlestick pattern. The chart is in breakout mode. Therefore, traders will be looking for a breakout above or below the yellow box, and then a measured move up or down next week.
The daily chart of the EURUSD Forex chart has been in a trading range for the 2 weeks since its sell climax. The odds are that the bear breakout will fail. This does not mean that there will be a bull trend. It simply means that the bear breakout will probably not lead to a bear trend. Hence, it could easily result in more trading range trading. As a result of the EURUSD Forex market being in a trading range for a year, traders expect more of the same. Therefore, in the absence of a big breakout with follow-through, they will bet that every breakout will fail.
All financial markets had been waiting for today’s unemployment report. Trend traders always hope that a report leads to a trend day. They don’t care if the trend is up or down. They simply look for consecutive big trend bars with strong closes, and then swing trade in the direction of the trend.
Bear breakout after the Unemployment Report
The EURUSD Forex chart broke below the June 30/July 6 double bottom on today’s unemployment report. Yet, it is down only 35 pips and still in the middle of the 2 week trading range. Furthermore, it is still above the June 27 higher low on the 240 minute chart. That low is the next magnet, if there is follow-through selling today. The bulls want the bear breakout to fail and for the EURUSD to reverse back above the double bottom low. The bears want today’s breakout to be a measuring gap that would lead to a test of the June 23 sell climax low.
The EURUSD Forex chart reversed the initial 80 pip selloff. This is a Big Down, Big Up candles stick pattern. It therefore creates confusion, which is the hallmark of a trading range. The EURUSD will probably be sideways for an hour or two, and possibly all day. This pattern usually leads to a measured move up or down. Since the range is about 100 pips, the measured move might come next week.
At the moment, day traders are scalping because of the trading range since the report. However, because of the increased chance of a trend up or down, they will be looking for opportunities to swing at least part of their position.
Summary of today’s S&P Emini futures price action and what to expect tomorrow
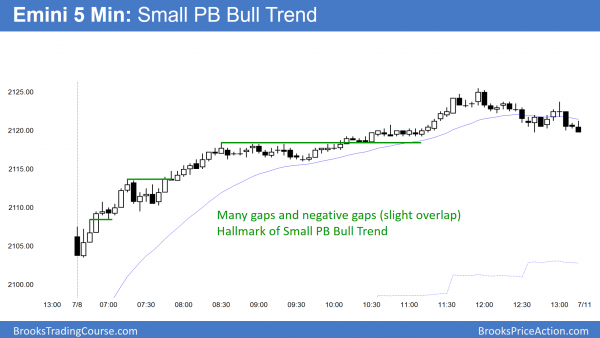
The Emini rallied in a Small Pullback Trend to a new all-time high. It pulled back into the close.
The cash index got to within a couple points of it all-time high from May 2015, but failed at the end of the day. The bears want a double top, whether or not the index goes slightly above the high next week. On the Emini daily chart, the bears want an Expanding Triangle top. The bulls want follow-through buying.
Today was a strong bull trend day. There is a 50% chance of follow-through buying in the 1st 2 hours on Monday, yet only a 25% chance of a strong bull trend day. There is a 70% chance of at least 2 hours of sideways to down trading that will begin by the end of the 2nd hour.
See the weekly update for a discussion of the price action on the weekly candlestick chart and for what to expect going into next week.
Traders can see the end of the day bar-by-bar price action report by signing up for free at BrooksPriceAction.com. I talk about the detailed S&P Emini futures price action real-time throughout the day in the BrooksPriceAction.com trading room, and a 2 day free trial is available.
When I mention time, it is USA Pacific Standard Time (the Emini day session opens at 6:30 am PST, and closes at 1:15 pm PST). You can read background information on the intraday market reports on the Intraday Market Update page.


Hi Al,
When we have spikes in opposite sides (e.g. On EU after NFP) and the chart is in a breakout mode then is it more likely that it will continue up and down rallies (within big TR i.e. 1.1003 – 1.1120) but keep narrowing down the TR to the point where it will setup Oii pattern to give a breakout entry even before it breakout from either end of the extreme. If this type of converging triangle develops then is it high probability trade to swing beyond the extreme of bigger TR (1.1003 or 1.1120).
Many Thanks
Saad
It sometimes does that. A triangle is another breakout mode pattern, but we already know it is in breakout mode. I am writing at 7:38 a.m. and there has been a deep pullback from the bull reversal to a new high. This deep pullback increases the chances of a triangle. Also, being in a trading range on the daily chart increases the chances of trading range price action on the 5 minute chart.
The bulls had a chance of a strong breakout on the reversal up, but the breakout immediately reversed down. If instead it continued up, then a bull trend day would have been more likely.
Thanks Al, much appreciated.
I read in one your books that in 50/50 probability situation, bulls and bears try to create channel in their direction. On 5mins/15mins EU chart, bears have been trying to create a channel down from 1.1055. Why will they try to start the channel from the middle of the TR when they know that by the time channel reach to the bottom of TR it will be overdone and will lack the strength bears need to break below the TR. Will bulls not pick this up and will be ready to buy relentlessly around the bottom of the TR and bears taking profit?