Posted 6:58 a.m.
The Emini reached a new all-time high on the open in a Trend From The Open rally. The bulls hope for a bull trend day. The bears want the breakout to fail, but realize that the rally might last several hours before there is a reversal down. The rally is strong enough so that the best the bears will probably get over then the next hour or two is a trading range. There is no sign of a parabolic wedge top.
Will the day be a big bull trend day? It might be, but whenever there is a breakout of a trading range, traders expect disappointment at some point. Until there is a strong reversal down or a strong top, the odds favor a bull trend day. In the meantime, bulls will buy pullbacks, betting that reversals will fail.
Pre-Open Market Analysis
S&P 500 Emini: Price action traders will buy put options
The Emini gapped up 7 trading days ago on May 25, but has stalled in a tight trading range at the all-time high. The bulls have had momentum on their side, but every bar that gets added to the tight trading range pushes that gap and the momentum further to the left, and the result is that the strong rally from the February low is losing its influence.
Remember what I have said many times about the 11 week bull micro channel on the weekly chart. There is typically a 1 – 3 bar pullback (this time, it was 4 weeks), then bull trend resumption for a few weeks, and then a TBTL Ten Bar Two Leg correction. The reversal up from the failed breakout below the April low increased the chances that the 4 month rally would lead to a new high. However, that 11 week bull micro channel is a buy climax, and traders have to be prepared for a possible break below the 7 day trading range and then a 20 point measured move down to the 2060 area. That would also be about a 50% pullback from the 2 week rally. The breakout could come with a gap down, creating an island top.
Since the Emini is in a trading range, traders have to expect disappointment. Just like the bears were disappointed by the reversal up from below the April low, if there is a new high this week, the bulls might get disappointed by a reversal down. The 11 week bull micro channel was a sign of very strong bulls. This means that a reversal down from here will probably be bought. However, the reversal down might retrace 50% of the entire rally up from the February low.
The bulls obviously want a successful breakout to a new all-time high and then a measured move up. It might come from a gap up. Although it is unlikely to stay open for months to years and be the start of a major rally above the 2 year trading range, that is unlikely. If there is a bull breakout on the monthly chart, the 2 year trading range will probably be the Final Bull Flag.
Until there is a strong breakout, there is no breakout, and traders have to be prepared for disappointment. The odds favor a new all-time high this week, but there is at least a 50% chance that it will fail within a week or two and retrace part of the rally from the February low. The location at the top of a 2 year trading range is good for the bears since the reward is bigger than the risk, and the probability is about 50%. This creates a good Trader’s Equation for put spread buyers, especially above the April high.
The Emini has been in a tight trading range for 7 days, but the momentum still favors the bulls. The odds favor at least a small new all-time high. However, every bar that gets added to the range reduces the probability for the bulls, and it will soon be the same as for the bears. Obviously, if there is a strong breakout up or down on the daily chart, it could lead to a swing that could last several weeks. Day traders are still fairly quick to take profits, betting that every 2 – 4 hour move will probably be followed by a trading range or an opposite move.
The Emini is up 6 points in the Globex market. It should try for a new all-time high this week, but the odds are better than 50% that the breakout will not get far before there is a pullback to test the April low, which would be 80 – 100 points below.
Forex: Best trading strategies
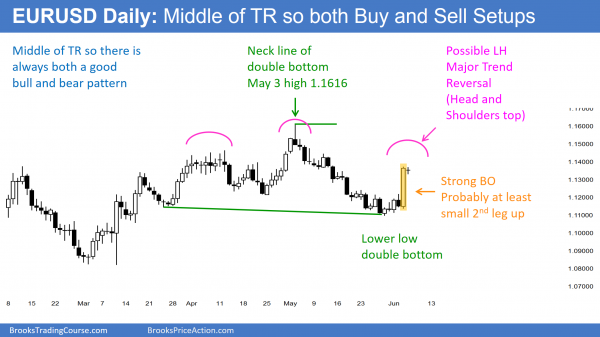
Friday’s rally reached a 50% retracement, and the EURUSD Forex chart is back to the middle of its 3 month trading range. In a trading range, there is always both a bull and bear pattern, and the probability of a bull breakout is about the same as for a bear breakout.
I have been writing for over a week that the daily chart of the EURUSD would probably have a 200 pip rally to the 1.1350 area. The bulls achieved their goal on Friday. The momentum up was strong enough so that bulls will probably buy the 1st reversal down. This means that there will probably be at least a small 2nd leg up. However, unless there is strong follow-through buying, nothing has changed from what I have been saying.
The EURUSD Forex chart has been in a trading range for 3 months and there is no sign that there will be a successful breakout soon. Whenever there is a trading range, the bulls and bears are about equally strong. They always both create a credible setup. The bulls see a double bottom. They want a break above the neck line and then a measured move up. The bears see a Head and Shoulders top. They want a break below the neck line (which is the bull double bottom) and a measured move down. Friday’s rally was climactic. It was also a move back to the middle of the trading range. The odds are that it will be followed by a few small sideways days. There will probably be at least a small 2nd leg up. Since the chart is still a trading range and now the EURUSD is testing into the top half, the rally is more likely to be followed by a test down than a bull breakout without a pullback.
As strong as Friday was, the rally is still probably a bear leg in a trading range and not the start of a bull trend. Since the EURUSD Forex chart is at the target, the odds favor hesitation by the bulls. This will probably limit the follow-through buying for the next couple of days. There might be a 1 – 3 day pullback, and then a 1 – 3 day leg up, but the odds are that the EURUSD Forex chart will be mostly sideways, because that is what usually happens after a Big Down, Big Up move.
The bears will see this rally as a lower high major trend reversal (right shoulder of a head and shoulders top) on the daily chart. The bulls see a double bottom bull flag with the March 16 low. There is a 40% chance that there will be a swing up or down and a 60% chance that the trading range since the March 16 pullback continues.
Because Friday was climactic, the odds are that there will be a lot of trading range price action on the 5 minute chart for a few days and online day traders will mostly scalp. However, if there is a strong reversal down or strong follow-through buying, traders will swing trade.
The EURUSD 5 minute chart has been in a 30 pip range overnight, which is consistent with what I just wrote.
Summary of today’s S&P Emini futures price action and what to expect tomorrow
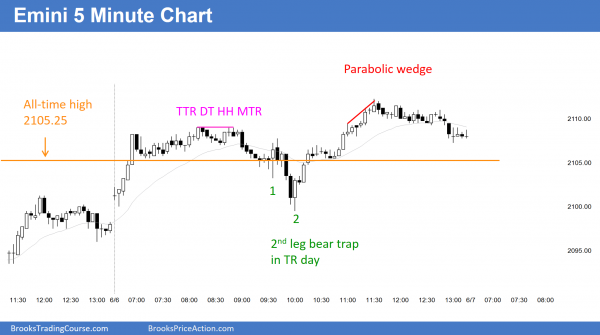
The Emini broke to a new all-time high. After a 2nd leg trap to test down to the old high, it rallied into the close.
Although the Emini made a new high, the cash index is still more than 20 points below its all-time high. If the cash index tests its high, the Emini will also rally about 20 points, which is therefore a resistance level.
I have been saying for a couple of weeks that a new all-time high was likely, but that the Emini would probably find sellers at the new high, just like it found buyers below the April low. The bears have expanding triangle tops on the daily and 60 minute charts. Most trading range breakouts fail. The 11 week bull micro channel on the weekly chart was likely to get a test of the top of the channel, which it did today, and then pull back. These factors all reduce the chances that this breakout will go straight up to a measured move target and increase the chances that it will pull back and test the April low. The probability of a test of the April low is about the same as the probability of a measured move up based on the height of the 3 month trading range. Traders have to be prepared to exit longs if this breakout reverses because it could easily fall 100 points over the next few weeks if the bulls give up.
See the weekly update for a discussion of the price action on the weekly candlestick chart and for what to expect going into next week.
Traders can see the end of the day bar-by-bar price action report by signing up for free at BrooksPriceAction.com. I talk about the detailed S&P Emini futures price action real-time throughout the day in the BrooksPriceAction.com trading room, and a 2 day free trial is available.
When I mention time, it is USA Pacific Standard Time (the Emini day session opens at 6:30 am PST, and closes at 1:15 pm PST). You can read background information on the intraday market reports on the Intraday Market Update page.


Hi Al,
would you clarify what is a ‘strong top’; do you mean MTR ? Thank you
A strong top has a strong sell signal bar and the context is good for a reversal instead of just a pullback.
MTR is Major Trend Reversal.
Because the EURUSD in in a trading range, it is unlikely to get a big 2nd leg up. More likely, there might be a pullback for a few days and then a small rally for a few days, and then a pullback to a trading range around Friday’s close.
Thank you.
Thank You Al, you are right the Friday break out was very strong . I want to ask when a move expected to come in 2 legs to reach certain target but the market rally very strong and reach that target in 1 leg it’s the probability of the second leg will diminish .
Thank You,