Posted 7:10 a.m.
The Emini began with a Small Bear Breakout of a Small Bear Breakout, which is a type of wedge bottom. The wedge began 11 a.m. yesterday. This is a breakout mode setup that can lead to a measured move up or down.
The rally on the open had a couple of big bear bars. This is more common in a trading range than the start of a bull trend, and it increases the chances of a test down. Many bulls are scalping out near the top of yesterday’s range and will look to buy again if there is a strong bull breakout. They would then look for a measured move up to the 60 minute moving average. However, without a strong bull breakout, the 2 hour trading range could continue. A trading range has bear legs as well as bull legs. The bulls need the breakout to convert the trading range into a bull trend.
The bears want a new low and a measured move down to the April low. Although the rally is weak, the Emini is currently Always In Long. However, until there is a breakout, there is no breakout, and traders will buy low and sell high. The bears still might get an early high of the day and a bear breakout. A trading range is more likely than a bear trend at the moment.
Pre-Open Market Analysis
S&P 500 Emini: Price action for day traders at support
April is a sell signal bar on the monthly chart. Although there are probably buyers below, no one knows for sure. This uncertainty has contributed to the trading range on the daily chart for the past 2 months, and I have mentioned this many times over the past 3 weeks. Bulls are hesitant to buy unless they are confident that they can overwhelm the bears if the Emini falls below the April low. Many bulls would like the monthly sell signal to trigger, and they will be quick to buy a reversal up. If there is a failed bear breakout, there could be a quick rally back up to the April high.
Although there could be a big bear breakout below the low (which is the April 7 low of 2026, and this is also the bottom of the Final Bull Flag on the daily chart), the odds are that the downside breakout would be limited. There is a Head and Shoulders top on the daily chart, but the right shoulder lasted only 3 bars. When a pattern lacks many bars, it is less likely to lead to a major reversal, and more likely to lead to a minor reversal and more trading range.
The Emini is down 5 points in the Globex market and it has traded in a narrow range. Whether or not there is a gap down is not important. All that matters is the April low. At the moment, there is more than a 50% chance that the Emini will fall below it within the next few days.
Because yesterday was a sell climax, there is a 50% chance of follow-through selling in the 1st 2 hours today and a 75% chance of at least a couple of hours of sideways to up trading that begins by the end of the 2nd hour. Yesterday ended with a double top bear flag at the moving average. That might be the Final Bear Flag. Traders will watch for a reversal. However, the key price is the 2026 April low. The Emini is so close that it might not be able to escape its gravitational pull. Then, traders will watch for either a failed breakout, or a strong breakout and a measured move down.
Forex: Best trading strategies
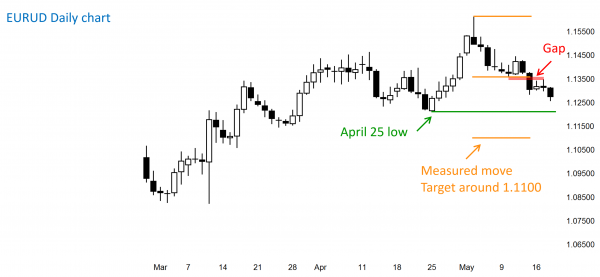
The EURUSD daily chart has a measuring gap after a wedge top.
The EURUSD Forex chart had a bear breakout on Friday, but Monday and Tuesday were doji bars on the daily chart. This is weak follow-through, and it slightly lowers the probability of a measured move down. The minimum objective was at least a small 2nd leg down. This has been met by the overnight selling. As long as the EURUSD Forex chart holds above the April 24 bottom of the last rally, the bulls hope that the selling of the past few weeks is just a bull flag and a bear leg in a broad bull channel on the daily chart. There is no sign of a bottom on any time frame so the bears remain in control at least at the moment. Any strong 1 – 4 hour reversal would be enough for the bulls to regain control.
The overnight selling means that yesterday’s high is the bottom of a possible measuring gap. This clear gap strengthens the case for the bears. The measured move target is based on the May 3 high to the top of the gap, which is the May 10 low. That target is around 1.1100. The bulls need a reversal up to above the May 10 bottom of the gap. The longer the gap stays open and the more the EURUSD Forex chart moves down, the more likely the bears will reach their minimum target based on the gap.
The bears on the daily and weekly charts see a wedge top, but they have been disappointed by the absence of big, consecutive bear trend bars. The bulls see a broad bull channel from the March low. The bull channel, and therefore the bull trend, remains intact as long as the EURUSD Forex chart continues to make higher lows. This makes the most recent higher low a magnet. That low is the April 25 low of 1.1214.
The bears are trying to get below it. If they succeed, traders will conclude that the bull trend has ended and has been replaced by either a trading range or a bear trend. For a bear trend, the bears need a strong bear breakout and follow-through selling, and then a series of lower highs and lows. More likely, if the EURUSD falls below the support of the April 25 low, there will be more buyers than sellers. However, it would then be close enough to the measured move target of 1.1100 that it would probably continue down to test support. A continued trading range is more likely than a bear trend, especially since the daily chart has been in a trading range for the past 6 weeks.
Summary of today’s S&P Emini futures price action and what to expect tomorrow
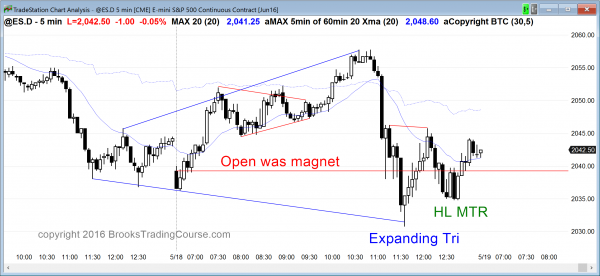
The Emin rallied for the 1st half of the day and sold off strongly on the FOMC minutes. It closed back near the open of the day and the day was a big trading range day.
Although the bears got a strong selloff, they were unable to break below the April low. The selloff was strong enough so that there might be a 2nd leg down, which could easily break below that low and trigger the sell signal on the monthly chart. However, the Emini might rally for a day or so before that 2nd leg begins.
The bulls are still trying to reverse up from the bottom of a 2 month trading range, but continue to fail to get follow-through buying.
The Emini is in a tight trading range on the daily chart and therefore it is in breakout mode and is neutral. Traders will be quick to take profits on the daily chart until there is a strong breakout up or down.
See the weekly update for a discussion of the price action on the weekly candlestick chart and for what to expect going into next week.
Traders can see the end of the day bar-by-bar price action report by signing up for free at BrooksPriceAction.com. I talk about the detailed S&P Emini futures price action real-time throughout the day in the BrooksPriceAction.com trading room, and a 2 day free trial is available.
When I mention time, it is USA Pacific Standard Time (the Emini day session opens at 6:30 am PST, and closes at 1:15 pm PST). You can read background information on the intraday market reports on the Intraday Market Update page.


I feel the same. We are talking about a test of MA after a reasonably strong trend. I always consider that higher probability than the ensuing MTR. My 2 cents.
Hi K P,
thanks for that.
What I find really interesting is that on a smaller scale that pullback to MA is commonly also consisting of a trend, a break and a test – so a (smaller) MTR.
So all really fascinating.
Also interesting what you say about the probabilities, I get that impression too as the ensuing trend after the first brake can continue very far beyond the extreme of the previous channel, meaning that MTR-setups would fail.
An common example of this would be a spike and channel, so the spike is a strong trend, then a break, and then a wide channel to the end of the day – all attempts at MTRs would fail… So I presume the chance of MTR goes down a lot if the initial trend is a narrow channel – ie a spike. However entering after the initial break of the channel would be a great trade.
Hi Al,
I am trying to trade with structure, with structure I mean trend/trend break/trend reversal (the last one you call MTR).
So I try to understand where we are in that cycle and I see more and more that this pattern repeats day after day and on different time scales, so in both major as minor moves. And seeing that is pretty fascinating I find, as it seems quite reliable.
I am trying to find MTRs and enter early in the move as I notice these moves are commonly very large and can therefore supply great risk/reward.
However I also notice that the move back to test the extreme of the trend after the initial break (I could call this Major Trend Break) of the trend tend to also be very large and often go far beyond the extreme of the previous trend. So to me it seems trading with trend after the initial break of the trend would also be a very good setup in terms of risk/reward? 051816 in ES an example would be buying the pullback at around 11 EST for a swing?
Do you agree with the above. I also presume the strength of the pullback as well as the strength of the trend is a major clue as to how far above or below the extreme of the previous trend prices will move after the break of the trend, is that correct? Are there other clues that are important to predict where the test of the previous trend will end?
Thanks!