Presidential election rally after sell climax
Updated 6:49 a.m.
The Emini had a big gap up on the open. When there is a huge gap up, the day usually goes sideways for several hours at some point, and rarely closes far above the open. About 20% of the days become strong bull trend days or strong bear trend days. Most close above the open, but spend at least half of the day within a tight trading range.
There is often a pullback below the low of the day and then a reversal up from near the moving average. The selloff often is a High 2 or wedge bull flag, and it often has many bear bars. Bulls should be ready to buy a reversal up from a double bottom with the 1st bar of the day.
While the odds favor a close above the open, today will probably not be a strong bull trend day. Furthermore, it will probably be mostly sideways.
Pre-Open Market Analysis
The Emini fell below the top of the July 2015 trading range on Thursday. Hence, the July 2016 breakout is an exhaustion gap. Furthermore, there were 7 consecutive bull trend bars on the monthly chart in August. In addition, my minimum target was a 100 point, 5% correction. The bears hit it last week. Finally, there are other lower targets, and you can read about them in the weekend blog.
For day traders, the Emini reversed up on Friday after a 3 day wedge bottom. Yet, the reversal failed and last week closed below the July 2015 top of the 2 year trading range. Because it formed a double bottom with the low earlier in the day, traders will look for a reversal up today. The reversal might be big and last 3 – 5 days because this is what often happens after a 2nd leg down after a top. See the weekend blog for more.
Since there is uncertainty about tomorrow’s election, the odds are there will be a lot of trading range price action. Furthermore, if the bulls can hold around Friday’s double bottom, they will probably get 2 legs sideways to up today and tomorrow. This is because that is what usually happens after a wedge bottom. Yet, there are still targets around 2040 – 2060. Therefore the any rally will probably be a bull leg in a trading range or a bear flag.
Overnight Globex trading
The Emini is up 29 points in the Globex session. While it is in part due to election certainty increasing, it has much more to do with the August tight trading range double top. As I have been writing since then, that type of top usually leads to 2 legs down. Furthermore, the 2nd leg usually lasts 2 – 5 bars and is a sell climax. Finally, there is then usually a sharp reversal up for 5 or more bars. If the reversal up did not begin overnight, it would have probably begun this week. This is true regardless of the election results.
Because there are still magnets around 2050, the Emini might have one more push down after today’s gap up. yet, the odds are that the Emini will work higher over the next couple of months. This is because the selloff is probably a bull flag on the monthly chart and not a reversal.
When there is a big gap up, it can lead to a big trend up or down. More likely, the Emini will go sideways for 2 – 3 days, and then go higher for several more days. It is already at the top of the wedge bear channel that began at November 1. That is a resistance level, and therefore increases the chances for sideways trading today.
Forex: Best trading strategies
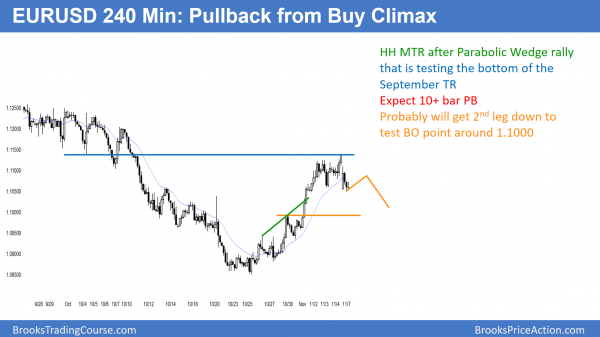
The buy climax on the 240 minute chart ended at the bottom of the September trading range. The odds are that it will trade sideways to down for 10 or more bars and 2 legs.
The EURUSD daily Forex chart rallied in a 9 bar bull micro channel. This is therefore a buy vacuum test of the bottom of the September trading range. The rally on the 240 minute chart is climactic. Furthermore, it traded in a range for 2 days. Therefore, the odds are that the range will be the Final Bull Flag, and the EURUSD will pullback for a day or two. In addition, it will try to get neutral before tomorrow’s election. Hence, a trading range is likely today.
Overnight EURUSD Forex trading
All financial markets have been under the control of the Emini August topping pattern. The Emini completed its expected sell climax last week. Because the odds are that the Emini will rally for 3 – 5 days, the EURUSD will probably go sideways to down for several days. This is also true because the daily chart of the EURUSD has a parabolic wedge buy climax at the resistance of the bottom of the September trading range.
While the 60 minute chart sold off for 8 hours, it has been in a small range for 5 hours. The bulls see the selloff as a double bottom bull flag with Thursday’s low. Yet, the bears see a higher high major trend reversal. Furthermore, they will see any bounce as the right shoulder of a head and shoulders top. Whenever there is both a reasonable bull and bear pattern, the market is in a trading range. Hence, it is in breakout mode. Because of the parabolic wedge top at resistance, sideways to down is more likely than up this week.
Summary of today’s S&P Emini futures price action and what to expect tomorrow
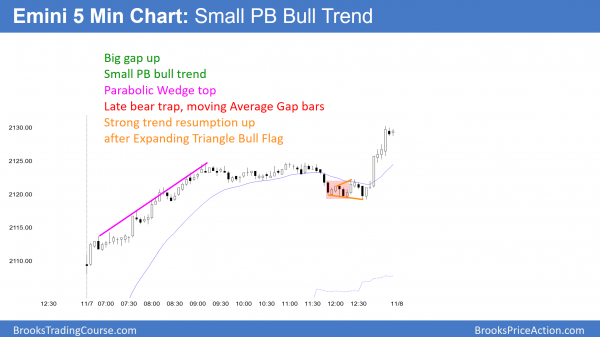
The Emini had a big gap up and then a small pullback bull trend. There was a late selloff from a higher high major trend reversal. Yet, it stalled at the daily moving average, and the bull trend resumed at the end of the day.
While similar to June 29, today was not as strong. Yet, the odds still favor follow-through buying this week. However, the election could quickly turn the Emini down to support around 2015 before there is an end of the year rally. The odds favor higher prices this week.
…
See the weekly update for a discussion of the price action on the weekly candlestick chart and for what to expect going into next week.
Traders can see the end of the day bar-by-bar price action report by signing up for free at BrooksPriceAction.com. I talk about the detailed S&P Emini futures price action real-time throughout the day in the BrooksPriceAction.com trading room. We offer a 2 day free trial.
When I mention time, it is USA Pacific Standard Time (the Emini day session opens at 6:30 am PST, and closes at 1:15 pm PST). You can read background information on the intraday market reports on the Intraday Market Update page.


