President Trump’s all time high stock market rally
Updated 6:47 a.m.
Today opened with a big doji in the bottom half of yesterday, which was a trading range day. The odds are that today will be another trading range day, but with legs that are big enough for swing trades. While the all-time high is 30 points above, each of the past 4 days were about 30 points or more. Therefore, it is possible for the bulls to put this week’s close at a new high.
The Emini reversed up on the open from a higher. This followed yesterday’s lower high. Today might be a continuation of yesterday’s trading range. Traders will be looking for a possible inside day and a 2 day triangle.
The initial reversal up was not strong. In addition, it followed a doji, which is a one bar trading range. Furthermore, yesterday was a trading range day. Hence, the odds are that today will have a lot of trading range price action. Also, this might be a trading range open for the 1st 1 – 2 hours. So far, this does not look like the start of a trend day.
Pre-Open Market Analysis
The Emini yesterday broke above of a bull channel on the open. Because 75% of bull breakouts above bull channels fail, it sold off. Yet, it found support at the bottom of yesterday’s bull channel. In addition, the bottom was strong. There was a parabolic wedge bottom and then a double bottom. Furthermore, there was a strong buy signal bar. As a result, the Emini rallied in a tight channel back up to test the high of the open.
Because the rally had many prominent bear bars, the odds were that it was a rally in a trading range. Yet, it lasted for several hours. The bulls got to within about 6 points of the all-time high. Because tomorrow is a Friday, the bulls will try to demonstrate strength at the end of the week. They therefore will try to have tomorrow and the week close at a new all-time high. As always, the bears want the opposite. Hence, they want this week’s rally to form a double top with the August high. The bull case is stronger.
Overnight Emini Globex trading
The Emini bounced over the past 3 hours after a 20 point overnight selloff. Yet, the selloff was still small compared to the size of Wednesday’s rally. While the Emini is still within 30 points of the all-time high, the selloff was probably big enough to prevent the bulls from getting a weekly close at a new high today. Therefore, today will probably be another big trading range day instead of a strong trend day.
Forex: Best trading strategies
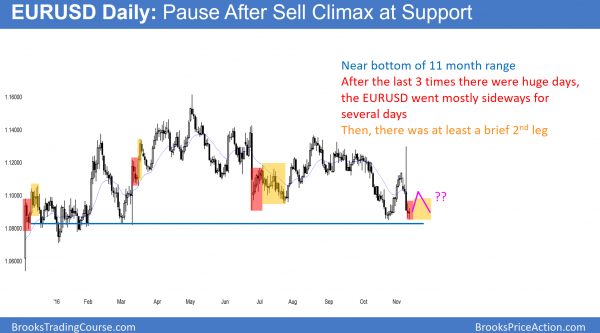
The daily chart had a huge bear day down to the bottom of the trading range. There were 3 other huge days. Each was followed by a pause for several days. Then, there was at least a brief resumption of the trend. Traders should therefore expect a bounce, and then a test of Wednesday’s low.
The EURUSD 60 minute Forex chart sold off more yesterday. Yet, the selloff since the early Wednesday lacked consecutive big bear trend bars. Furthermore, the bars were small, had a lot of overlap, and had prominent tails. While these are characteristics of legs with a trading range, the reversal up late in the day was not strong. The 60 minute chart therefore remained in a bear channel, in search of a bottom.
Yet, it was strong enough to create a doji bar on the daily chart. Therefore, yesterday was a bad follow-through bar on the daily chart. Furthermore, it was near the bottom of the yearlong trading range. Since the huge reversal down is stalling at support, the odds are that the EURUSD chart will go sideways for a few days. The bear will see the small range as a bear flag. The bulls will see it as a base at support.
Overnight Forex trading
The 60 minute EURUSD had 3 pushes down in a channel after the huge bear breakout. Hence, it formed a wedge bottom. While it has reversed up 65 pips over the past hour, this is small compared to the size of the selloff. A wedge bottom usually has a couple of legs sideways to up. In addition, the chart then usually forms a trading range. It therefore enters Breakout Mode. Hence, this is what is likely over the next week.
Summary of today’s S&P Emini futures price action and what to expect tomorrow
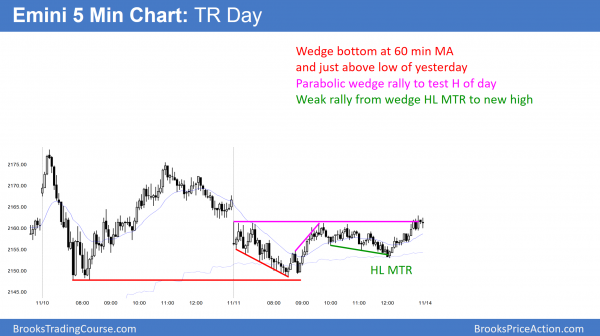
The Emini sold off in a weak wedge bear channel. It reversed up from the 60 minute MA, just above yesterday’s low. It reversed up again from a higher low major trend reversal to a new high.
Today was a trading range day that closed near its high. The odds favor a test of the all-time high next week. The bears probably would need at least a micro double top on the daily chart before getting a reversal. The odds favor the bulls.
See the weekly update for a discussion of the price action on the weekly candlestick chart and for what to expect going into next week.
Traders can see the end of the day bar-by-bar price action report by signing up for free at BrooksPriceAction.com. I talk about the detailed S&P Emini futures price action real-time throughout the day in the BrooksPriceAction.com trading room. We offer a 2 day free trial.
When I mention time, it is USA Pacific Standard Time (the Emini day session opens at 6:30 am PST, and closes at 1:15 pm PST). You can read background information on the intraday market reports on the Intraday Market Update page.


