Possible island bottom after Trump’s island top
Updated 6:50 a.m.
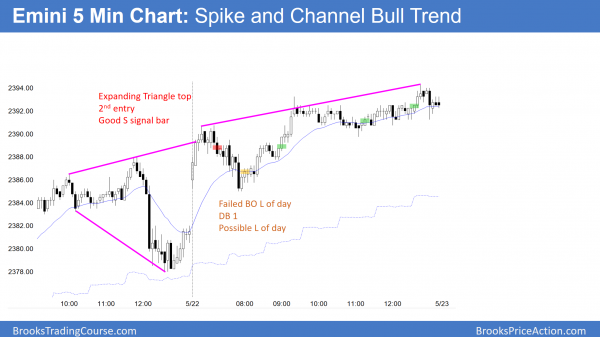
The Emini broke above yesterday’s high with 3 bull bars on the open. Yet, the odds favor an inside week with a lot of trading range price action. This reduces the chances of a strong trend day up or down.
The Emini is Always In Long and is in a Trend From The Open Bull Trend. The bears will probably need either a 2nd failed breakout above Friday’s high, a parabolic wedge top, or a series of bear bars to take control. There is no sign of any of these yet.
At the moment, the odds are that today will either be a weak bull trend day or a trading range day. Most likely, this early rally will be a bull leg in a trading range or in a trending trading range day. It will therefore probably end up as a test of last week’s gap down, and enter a trading range by the end of the 1st hour.
Pre-Open market analysis
The Emini continued its reversal up on Friday. If the Emini gaps up this week, it will create an island bottom. While this is bullish, the Emini is still in its 2 month range. In addition, the buy climax on the weekly chart is extreme. There is therefore only a 30% chance of a strong rally from here without 1st pulling back to the weekly moving average.
Because the Emini had a big range last week and this week will probably open in the middle third of that range, this week has an increased chance of being an inside week. Hence, the odds favor the days developing more trading range price action. This is especially true since it is now back in the middle of the May trading range.
Overnight Emini Globex trading
The Emini is up one point in the Globex session. Furthermore, it traded in a narrow range overnight. While there will probably be residual energy up and down, the odds favor increasing trading range price action this week.
EURUSD Forex market trading strategies
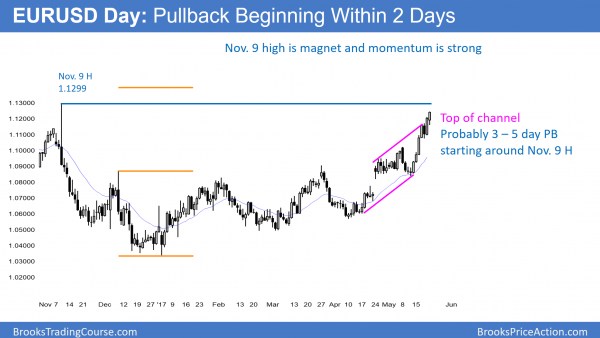
The May rally on the daily chart is within 50 pips of the November 9 top of the bear trend. Since the momentum up is strong, the odds are that the EURUSD Forex market will closer to it, and possibly slightly above it, this week.
The momentum up on the daily EURUSD Forex chart is strong. The November 9 high was the start of a dramatic selloff. It is therefore a magnet that is pulling the market up. Since the EURUSD is now only 50 pips away, and that is close on the daily chart, it might pull back this week before hitting the target.
Even if the bulls break strongly above that high, the EURUSD is still in the middle of a 2 year trading range. Therefore any strong selloff or rally is still likely to be just another leg in that range. Traders need to see a strong breakout from the range before they will conclude that there is a new trend on the weekly chart.
Likely selling around November 9 high
While it can continue up strongly above the target, it will more likely begin to hesitate. This is partly because the rally is extreme. Hence, the stop for the bulls is far below. Consequently, their risk is now getting unacceptably large. Many will therefore reduce their risk by taking partial profits. This will probably create a pullback that could last several weeks.
Furthermore, there were bulls who bought on November 9 and held through the entire 2 month selloff. They believed that as long as any selloff stayed above par (1.0000), their premise of a bottom around the 2015 low was still reasonable. Since the selloff fell below that 2015 low, many are questioning their premise. They will get out around their entry price of November 9. Consequently, some bulls will be selling here.
Finally, the strong bears want to prevent any strong rally above such an important high. As long as they can prevent that, they can argue that the EURUSD market will form a double top with that high. They therefore will sell around that high.
Overnight EURUSD Forex trading
The EURUSD Forex market rallied again last night. Yet, the overnight pullback fell below Thursday’s high. Since that was a breakout point on the 240 minute chart, the pullback overlapped a breakout point. Consequently, bears are beginning to sell above prior highs and scalp. Hence, some will be selling the rally of the past 4 hours, betting there will be a pullback below the high from 11 o’clock last night.
This is also the 3rd leg up since Wednesday. The bears therefore have a wedge bull channel. Since Friday’s 2nd leg up was strong, it might have reset the count. Yet, a channel where the pullbacks overlap the breakout points is a stairs pattern. It therefore is a lessening of the momentum up. Furthermore, it usually leads to a trading range.
Trading range beginning this week?
Since there will probably be selling around the November 9 high and the 240 minute chart is now having some deeper pullbacks, the odds are that the EURUSD market will begin to pullback from around the November 9 high.
While it is still easier for day traders to make money buying pullbacks and bull breakouts, the bears will probably begin to make money as well. In addition, the bulls will probably be quicker to take profits now that the rally is near major resistance.
The odds therefore favor a transition into a trading range within a week. Since the rally has been so extreme, the trading range could last a couple of weeks. In addition, it could be 200 pips tall. There is no sign of a top yet and there is still a strong magnet above. Yet, this week will probably bet the start of a trading range.
Summary of today’s S&P Emini futures price action and what to expect tomorrow
The Emini traded down from a new high and then up from a new low. It therefore was in breakout mode. Yet, the bull breakout led to a tight trading range.
Since this week will probably be an inside week, the Emini will probably test near last week’s high and low. Because it is now near the high, it will probably start to test down tomorrow or Wednesday. The week will probably have a lot of trading range trading. If there is a breakout to a new all-time high, the rally will probably not go far. This is because the buy climax on the weekly chart is extreme. Hence, the Emini will probably have to pull back to its moving average before it can go much higher.
See the weekly update for a discussion of the price action on the weekly candlestick chart and for what to expect going into next week.
Traders can see the end of the day bar-by-bar price action report by signing up for free at BrooksPriceAction.com. I talk about the detailed S&P Emini futures price action real-time throughout the day in the BrooksPriceAction.com trading room. We offer a 2 day free trial.
When I mention time, it is USA Pacific Standard Time (the Emini day session opens at 6:30 am PST, and closes at 1:15 pm PST). You can read background information on the intraday market reports on the Intraday Market Update page.


Hi Al,
A lot more people are trading the SPY than the emini, there is research saying that the emini is now following the SPY since institutions beginning to favor passive investing strategy.
Should we look at the SPY chart for more clarity, than the emini chart?
Years ago, that was true, and I often relied more on the SPY than the Emini. I now think the Emini is dominant and more important than the SPY. If a trader is trading the SPY, I would only look at the SPY. If he is trading the Emini, I would only look at the Emini.
Because so many traders only trade stocks and ETFs, the SPY will continue to be important for many years. Yet, I think it is now less important and less reliable for day traders than the Emini. But, is it close to just as good.