Nested expanding triangles and final flags
Updated 6:52 a.m.
Yesterday was a bear channel, and therefore a bull flag. Yet, it was also a Spike and Channel Bear Trend, which usually evolves into a trading range.
Two of the 1st 3 bars were dojis and today opened in yesterday’s range. This is consistent with the trading range price action of the past 3 weeks. It therefore increases the chances that today will be more of the same. While most days trended up and down enough for swing trades, traders have been mostly scalping.
The odds still favor a move up to the targets around 2200 before the reversal begins. Yet, yesterday was a sell signal bar for a failed breakout above the 3 week range. Any reversal down can be the start of the August pullback. Friday’s bull breakout was strong enough so that the bears will probably need at least a micro double top. Therefore there are probably buyers below yesterday’s low.
The Emini is Always In Long, but not strongly bullish yet. The open was exactly in the middle of yesterday’s range. This increases the chances of a test of both yesterday’s high and low today. Traders will look for a reversal at those 2 prices.
While a strong trend day can come at any time, this open is more consistent with either a weak trend or a trading range. Unless there is a strong breakout with follow-through, traders will expect every swing to be followed by an opposite swing.
Pre-Open Market Analysis
The Emini has a nested top on the monthly, weekly, and daily charts. Yet, it is still in a bull trend. The bears therefore need a strong bear breakout with follow-through to convince traders that they have taken control. There is a 60% chance that they will succeed in August. However, there are still magnets above around 2200 and 2220. Hence, the bulls might get one more strong rally before the bears take control. That final rally might be very strong to trap the final weak bulls in and the weak bears out.
Because the Emini is still in a bull trend, it could continue up much longer. Yet, because of the extreme number of bars without a pullback on the monthly and daily charts, the odds favor a pullback soon. This is especially true because of the nested Final Flag (or Expanding Triangle) Tops.
Breakouts from extremely tight trading range breakouts can be very big
The Emini has been in an unusually tight trading range for a month. The breakout from such an extreme range is often very big. Yet, it fails and reverses 50% of the time. Traders need to be very careful over the next few weeks because a big breakout will probably take place. If traders only see the tight trading ranges and assume that today will be more of the same, they will likely be in denial when the breakout comes. Traders often struggle when the markets switch to swing trading. Yet, this will happen soon, and traders need to change once the market changes.
Forex: Best trading strategies
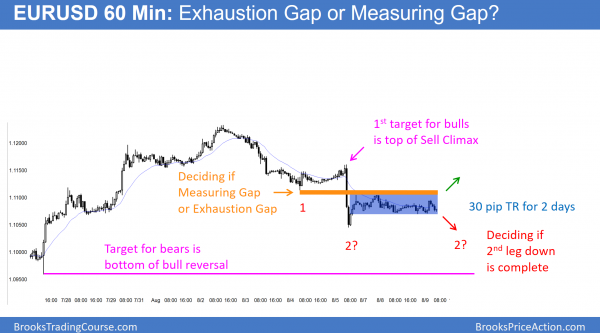
The 60 minute EURUSD Forex chart has been in a 30 pip tall tight trading range for 2 days. It is deciding if last week’s big bear breakout is the start of a new leg down (Measuring Gap) or the end of a leg down (Exhaustion Gap). The bulls need to get at least 10 pips above the top of the gap (the bottom of the breakout point, which is the red 1) before traders conclude that the bears have lost.
The EURUSD has been in a tight trading range 6 weeks on the daily chart and for 2 days on the 60 minute chart. While the Emini does not typically influence the Forex markets very much, it might in August. Because the Emini has nested Expanding Triangle Top and Final Flag Top patterns, the odds of a top in August are at least 60%. By top, I mean on the daily chart, which will probably pull back 3 – 5%. Yet, this will still simply be a bull flag on the weekly and monthly charts.
Because all financial markets are related, when there is a surprisingly fast, big move in one, it usually affects the others. Yet, it is impossible to know whether the EURUSD breakout will be up or down. Because the EURUSD daily chart had a sell climax on August 5, the odds are that the bears are exhausted. Yet, the pause has been long enough so that they are as willing to sell as the bulls are to buy. The 60 minute and daily charts are in Breakout Mode. They therefore have a 50% chance of going up or down.
What happens after a sell climax?
While a sell climax stops the bear trend, it does not typically start a bull trend. Rather, the market most often goes sideways for 10 or more bars. That is what the EURUSD has been doing on both the 60 minute and daily charts. Once the bears are confident that the sell climax will not lead to a reversal, they will sell again. As a general rule, they wait TBTL Ten Bars, Two Legs.
The current pullback has just about met that minimum. Since the bulls have been unable to reverse the EURUSD daily chart back up, the probability of a reversal is falling from 60% to about 50%. This means that the EURUSD is in Breakout Mode on the daily chart. The probability of the next swing is about the same for the bulls and bears.
Overnight EURUSD Forex Market
The 5 minute EURUSD Forex chart overnight stayed in a 20 pip range. This is so small that it is even difficult for scalpers to make much money. Most traders should wait for a breakout up or down. Those who day trade when the range is this small are mostly entering with limit orders. Hence, they buy below prior lows, use 20 – 30 pip stops, scale in, and scalp for 10 pips. They sell above prior highs and scalp as well.
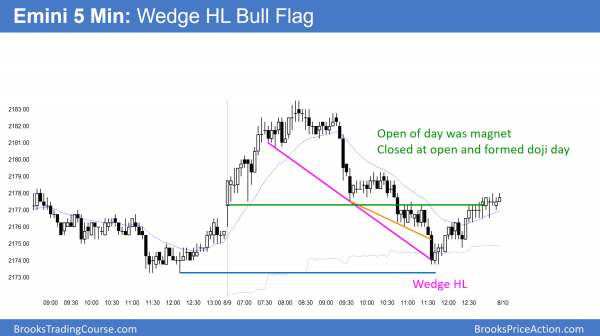
The Emini opened exactly at the midpoint of yesterday’s range. It then rallied above yesterday’s high and then tested yesterday’s low. While today made another new all-time high, it was a trading range day in a month long trading range.
The Emini opened exactly at the midpoint between yesterday’s high and low. This made it likely to test both at some point today. Hence, traders looked to sell the reversal down from the high. After testing yesterday’s low and the 60 minute moving average, the Emini reversed back up to the open.
As was likely after the 1st few minutes today, today tested both yesterday’s high and low. The nested Final Flag pattern appeared now on both the 5 and 60 minute charts, in addition to the daily, weekly, and monthly charts. This increases the chance that a 40 – 100 point reversal will begin soon. While there are still targets above, this nested pattern reduces the chances that the Emini will get to 2200 before the August correction.
When there is a topping pattern like this, the Emini sometimes strongly breaks above it. It therefore runs the stops on the weak bears. Yet, it then immediately reverses down and falls violently. Traders have to be aware of this possibility so that they will not be paralyzed with fear and confusion.
See the weekly update for a discussion of the price action on the weekly candlestick chart and for what to expect going into next week.
Traders can see the end of the day bar-by-bar price action report by signing up for free at BrooksPriceAction.com. I talk about the detailed S&P Emini futures price action real-time throughout the day in the BrooksPriceAction.com trading room. We offer a 2 day free trial.
When I mention time, it is USA Pacific Standard Time (the Emini day session opens at 6:30 am PST, and closes at 1:15 pm PST). You can read background information on the intraday market reports on the Intraday Market Update page.


