Nested Emini final flag and expanding triangle top
Updated 6:52 a.m.
The Emini again opened exactly in the middle of yesterday’s range. This increases the chances for a trading range day. This is especially likely since yesterday was a trading day and today opened in a tight trading range from yesterday’s close and in the middle of yesterday’s range. In addition, the first bars today were limit order, tight trading range bars.
Since the Emini opened exactly in the middle of yesterday’s range, online day traders expect a test of either yesterday’s high or low, and then a reversal and a test of the opposite end of yesterday. Furthermore, they expect a 2nd reversal and then closes back near the open.
While today opened with a Lower High Major Trend Reversal, the bears need a strong bear breakout before traders conclude that today will be a trend day. Yet, a strong trend day can come at any time. However, the odds are against that today. More likely, today will be a trading range day or a weak trend day. Furthermore, there will probably be swings both up and down.
Pre-Open Market Analysis
The Emini did something very unusual over the past 2 days. By trading below the 5 minute and 60 minute trading ranges, reversing up to a new high, and then reversing down, it therefore completed a nested pattern. The daily, weekly, and monthly charts have the same topping pattern.
Nested topping patterns on 5 time frames!
When a topping pattern forms within a bigger version of the pattern, it forms a nested pattern. Two time frames both trying to reverse therefore makes a reversal more likely. A pattern that is nested on 5 time frames is extremely rare. Hence, it increases the chances of a reversal on all of the time frames. While this is likely, the reversal on the monthly and weekly charts will probably be bull flags. Yet, a 40 – 100 point selloff on the 60 minute chart is a bear trend.
Risk of buy climax
Very few traders see the 5 time frames of a nested top. Yet, most traders see one or more of the tops. Whenever there is a topping pattern that is fairly obvious, and the bull trend is strong, it often traps traders. The short triggers. Yet, the buyers come back and the weak, scared bears quickly buy back their shorts if the initial selloff is not strong.
This often results in a sharp rally to a new high. This therefore traps weak bears out. The strong rally above the top also traps weak bulls into buying because they are afraid of missing a huge new leg up. Yet, this is more often a final buy climax that leads to the start of the correction.
Emini Globex market
The Emini is up 3 points in the Globex session. Because yesterday’s selloff held above the bottom of Monday’s rally, it was a higher low in a bull trend. Yet, yesterday’s selloff was strong enough so that the bears have a 50% chance of a 2nd leg down from a Lower High Major Trend Reversal. The 5 minute Emini chart is in breakout mode after yesterday’s Big Up, Big Down candlestick pattern. That created a reversal on the 60 minute chart. The bulls hope that the 2 day trading range is a bull flag. Because of the Breakout Mode pattern, they, too, have a 50% chance of success.
Forex: Best trading strategies
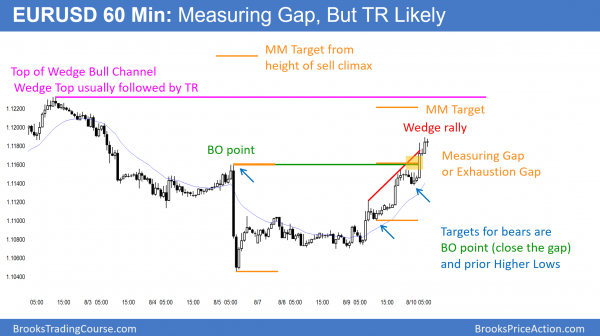
The EURUSD 60 minute Forex chart broke strongly above the top of August 5 sell climax. While the wedge rally is strong, it comes after a Wedge Top. This rally is probably a bull leg in a trading range. The overnight breakout might lead to a measured move up. Yet, it has 3 pushes and is therefore a possible Wedge Top. Furthermore, since trading ranges usually disappoint bulls and bears, and this rally is probably a leg in a trading range, the odds are that it will turn down before breaking strongly above the top of the Wedge Top (the highest price on the chart).
Yesterday closed the gap below the August 4 breakout point. Yet the rally immediately stalled. The bears still see the 2 legs up from the August 5 sell climax as a bear flag. The bulls therefore need to do more to convince traders that they are in control. If they do take control, their 1st target is the top of the August 5 sell climax.
Stock market top
I mentioned that the Emini is forming a nested topping pattern on the daily, weekly, and monthly charts. The 60 minute and 5 minute charts now have the same Final Bull Flag and Expanding Triangle topping pattern. A nested pattern has a greater probability of success. It is extremely rare for the same pattern to be nested on 5 time frames. As a result, this increases the odds that the Emini will reverse down 2 – 5% over the next few weeks.
Since all financial markets are related, a big move in the Emini will probably result in a big move in the Forex markets. Yet, it is impossible to know in advance if an Emini selloff will create a selloff or rally in the EURUSD. Part of the difficulty is that traders do not yet know if the European stock markets will fall as much as the Emini. Furthermore, they might even fall more. In conclusion, there will probably be a breakout in the EURUSD at some point this month. Traders should be prepared for a swing trade up or down.
Overnight Forex markets
The EURUSD Forex market rallied strongly overnight and broke above the August sell climax high. While this breakout is big and the odds favor higher prices, it is still probably only a bull leg in a trading range. The August 2 Wedge Top led to 2 big legs down. That selloff was probably just the 1st of a bigger 2 legged correction. Hence, this rally is probably the pullback from that 1st leg down. This therefore means that this rally is probably a bull leg in a trading range that began with the August 5 Wedge Top.
While the overnight breakout was strong enough to have at least one more push up after its 1st pullback, the odds are against a strong breakout above the August 2 Wedge Top before there is at least a 2nd leg down from that top. The targets for the bulls are measured moves based on last night’s gap and based on the height of the August 5 sell climax. Finally, the Wedge Top is a target. The bulls need a strong breakout above that top to convince traders that this rally is more than a bull leg in a trading range.
5 minute chart
The EURUSD 5 minute chart is strongly bullish, yet the bull flag of the past 2 hours might be the Final Bull Flag. A bull breakout would be the 3rd push up and it therefore create a wedge top. This would probably be followed by a couple of legs down and a trading range. Since this 5 minute Wedge is nested within a 60 minute Wedge, the odds of a sideways to down correction lasting at least a couple of hours are even higher.
Summary of today’s S&P Emini futures price action and what to expect tomorrow
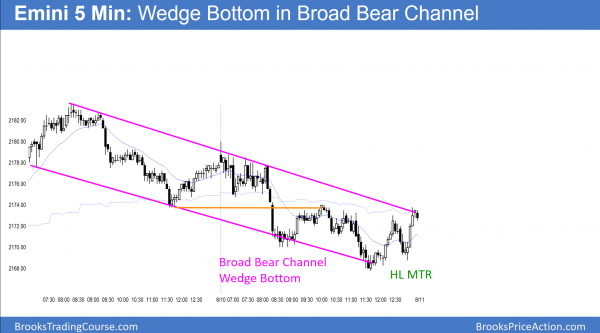
The Emini sold off in a Trending Trading Range Day and a Broad Bear Channel. It reversed up from a Wedge Bottom and stalled at the 60 minute MA.
The Emini reversed down today from a nested top on 5 time frames. If tomorrow gaps down, the Emini will have a 4 day island top of the daily chart. The bulls will buy any move below today’s low to weaken the bear case. Furthermore, they want the 2 day selloff to be a bull flag that will lead to the next leg up. The context is good for the bears. Yet, the momentum is still good for the bulls. The odds favor a 40 – 100 point pullback this month.
See the weekly update for a discussion of the price action on the weekly candlestick chart and for what to expect going into next week.
Traders can see the end of the day bar-by-bar price action report by signing up for free at BrooksPriceAction.com. I talk about the detailed S&P Emini futures price action real-time throughout the day in the BrooksPriceAction.com trading room. We offer a 2 day free trial.
When I mention time, it is USA Pacific Standard Time (the Emini day session opens at 6:30 am PST, and closes at 1:15 pm PST). You can read background information on the intraday market reports on the Intraday Market Update page.


Hi Al,
When wedge bottom fails and price drop to the measured move target equal to the height of wedge. If this drop also has shape of wedge then does that increase the probability to more than 60% that it will test the breakout point (top of second wedge and bottom of first wedge)?
Many Thanks
You are referring to consecutive climaxes. For example, if there are consecutive wedge bottoms with good shape, the odds of a reversal to above at least the bottom of the 1st wedge are very high, maybe 70% if the shape is good.
Thanks a lot.
Keen insights again today Al. Thank you.