Market ignoring London terror attack and Trump’s Russia Probe
Update 6:49 a.m.
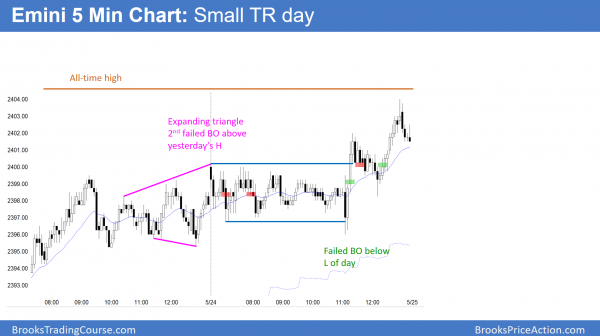
The day opened above yesterday’s high and 2400, and reversed down from a 3 hour expanding triangle top. The 1st 2 bars were bear bars and therefore the Emini is Always In Short. Yet, the bodies were small and both had prominent tails. Hence, the bulls will try for an Opening Reversal up from the moving average. If they get a new high, the bears will sell again on a 2nd failed break above yesterday’s high.
The past 2 days had a lot of limit order, trading range trading. This open looks similar. Hence, while the Emini is Always In Short and might form an outside down day, it might have to go sideways for an hour or more.
The bulls need a strong breakout above the high. Because last week was not a good bar for the bulls and the Emini is around that high, the odds are against a strong bull trend day day. More likely, it will either be a trading range day or a weak bear trend day. Since yesterday was small, the bears might get an outside down day. In addition, the magnet of the 60 minute moving average is around yesterday’s low.
Pre-Open market analysis
Since last week was a big bear doji on the weekly chart, and it closed in its middle, the odds are that this week will be an inside bar. That would therefore create an ioi breakout mode pattern.
Since an inside week is likely and the 1st 2 days are near last week’s high, the odds are that the next day or two will test down. The low of last week is probably too far to reach this week. Yet, last week’s close is a target.
The bulls want the bull trend to continue up above last week and therefore make another new high. Hence, that would make last week a buy signal bar on the weekly chart. Yet, a big bear doji in a 5 week tight trading range is a low probability setup for a strong rally.
Weekly buy climax might get relieved by sideways trading
Furthermore, the weekly chart has not touched its moving average in 28 weeks, which is extremely unusual. Therefore the upside is probably minimal for the next several weeks.
In addition, the Emini will probably have to fall below the weekly moving average within the next few weeks before the bulls will want to buy again. It can get to the average by going sideways or down. The average is about 60 points below the current price, but rising fast.
Overnight Emini Globex trading
The Emini is up 1 point in the Globex market. It is trading just below last week’s high, which is the all-time high. Since last week was a bad buy signal bar, the odds are that the bears will take control in this area for a day or two. Therefore, unless the bulls break strongly above last week’s high, traders will look to sell rallies for swings down from a double top.
Because the Emini has been in a trading range for 2 months, most days are trading range days. Hence, day traders are mostly scalping. Yet, there has been at least one brief swing everyday. In addition, because of the many tight trading ranges, experienced scalpers are finding more limit order entries than stop order entries.
EURUSD Forex market trading strategies
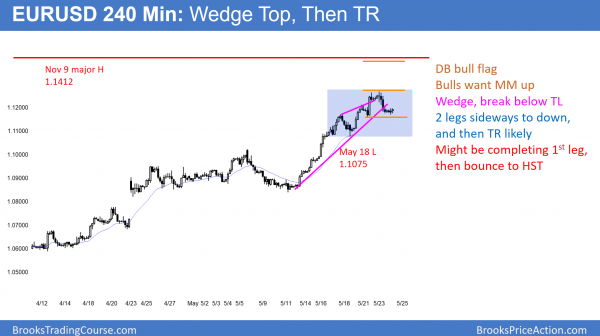
The EURUSD 240 minute Forex chart broke below the bull trend line. Since there was a wedge top, traders should expect 2 legs sideways to down. Furthermore, a 2 week trading range is likely. The bulls see a double bottom bull flag and want a break above the November 9 high.
The daily chart had a strong breakout 2 weeks ago, but has hesitated twice since. The bulls want the momentum to carry the market above the November 9 lower high at 1.1412. Yet, the rally is probably too strong. Hence, the stops for the bulls are far below. Therefore, many are taking partial profits. As a result, there have been 2 big bear bars in the past 4 days.
Since this profit taking is far below the November high, the odds are that the chart will form a trading range here. In addition, it will probably last a couple of weeks.
Overnight EURUSD Forex trading
Yesterday’s selloff broke below the bull trend line on the 240 minute chart. Since the channel was a wedge, 2 legs sideways to down are likely.
The bulls bought yesterday’s low. Therefore, the selloff since yesterday might be the 1st leg down. Yet, if the EURUSD 240 minute chart turns down again from a lower high, the 2nd leg down will probably test the May 18 bottom of the wedge around 1.1100.
The odds are that it would then bounce and form a trading range for a couple weeks. If so, the chart would be in breakout mode. But, the November high is a strong magnet. Furthermore, the momentum up is strong. Hence, even in Breakout Mode, the odds would still favor the bulls. The trading range on the 240 minute chart would therefore simply be a bull flag on the daily chart.
Because the current 1st leg down on the 240 minute chart is hesitating at Monday’s low, the bulls are hoping it will reverse up from a double bottom with that low. In addition, yesterday’s high is the neck line of that double bottom bull flag. A measured up above would almost reach the target of the November 9 high.
Since the bulls and bears now have reasonable setups on the 240 minute chart, the chart will probably enter a trading range for a couple of weeks. Therefore, day traders should expect to mostly scalp.
Summary of today’s S&P Emini futures price action and what to expect tomorrow
The Emini was in a small range all day.
After a bear breakout, it reversed up to a new high, but failed to reach the all-time high.
Today was another quiet trading range day. Because of the relentless rally for 3 days, there is now a 50% chance of a break above last week’s high tomorrow or Friday. Yet, the odds still favor a test down to the weekly moving average within a few weeks. There is now an increased chance of a big breakout to a new all-time high. If so, it will probably be brief. Furthermore, it will probably lead to a climactic pullback over the next 2 months to below the weekly moving average.
See the weekly update for a discussion of the price action on the weekly candlestick chart and for what to expect going into next week.
Traders can see the end of the day bar-by-bar price action report by signing up for free at BrooksPriceAction.com. I talk about the detailed S&P Emini futures price action real-time throughout the day in the BrooksPriceAction.com trading room. We offer a 2 day free trial.
When I mention time, it is USA Pacific Standard Time (the Emini day session opens at 6:30 am PST, and closes at 1:15 pm PST). You can read background information on the intraday market reports on the Intraday Market Update page.


