Posted 7:00 a.m.
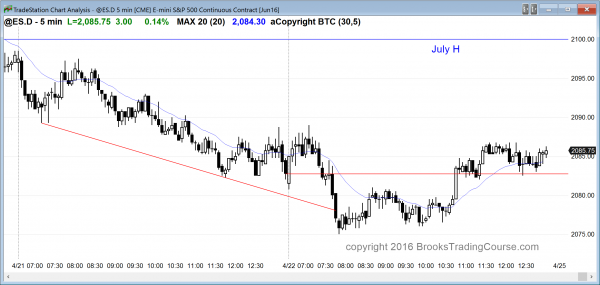
The Emini reversed up from below yesterday’s low in the first minute of the day. Although it had several consecutive bull bars, they had prominent tails. This happens more in a bull leg in a trading range than in a bull trend. Unless the bulls get a strong bull breakout above the trading range and the 60 minute moving average, the odds favors continued trading range trading. The Emini was in a trading range for the last 20 bars yesterday.
The bears want trend resumption down. They need a strong bear breakout. Since most of the pullbacks over the past month on the daily chart lasted only 1 – 3 days, and today is the 2nd day down, traders will be hesitant to sell low unless there is a very strong bear breakout.
The Emini is Always In Long, but weakly bullish. Most traders will continue to scalp until there is a strong breakout up or down. This early trading range price action increases the chances of a lot of trading range price action today.
Pre-Open Market Analysis
S&P 500 Emini: Learn how to trade a pullback candlestick pattern
Yesterday was the entry bar for the failed breakout to a new all-time high. The bar closed on its low and was reasonably big. This favors the bears. The Emini is getting back to the 2067 top of the 3 week trading range. The bulls want another leg up from there. The bears want a test to the 2030 bottom of the range. Even though the Emini is very overbought on the weekly and daily charts, it could become much more overbought before it pulls back. It is more likely that it will begin to test down to the 2030 area and form a trading range that could last at least a month or two.
The cash index did not reach its prior all-time high so there is still a magnet pulling the market up. The divergence is only minor and it is less important than other things on the chart, like the potential Final Bull Flag.
The selloff yesterday was climactic. There is therefore a 50% chance of follow-through selling in the 1st hour or two. There is a 75% chance of at least 2 hours of sideways to up trading beginning before the end of the 2nd hour.
The 60 minute chart’s reversal down created a Big Up, Big Down candlestick pattern. the odds are that the 1st reversal up will be sold and that there will then be a 2nd leg sideways to down.
Today is a Friday so weekly support and resistance are important, especially at the end of the day. The most important target is the 2100 previous all-time high. The weekly chart is in an 11 bar bull micro channel. That is unusual and therefore climactic. There is a 70% chance that next week will trade below this week’s low.
Forex: Best trading strategies
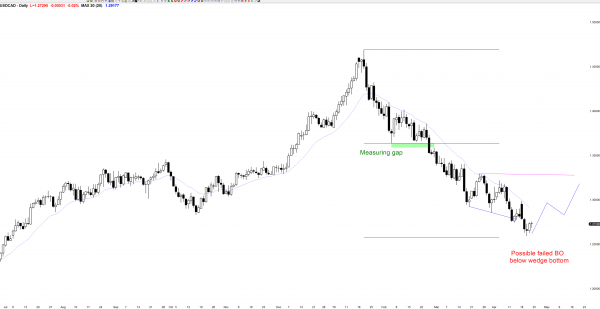
The daily chart of the USDCAD has a possible failed breakout below a wedge bottom. The odds favor a 600 pip rally, but there might be one more minor low first.
I am writing about the USDCAD today because it has an interesting pattern. I wrote about it topping out in January. It now is probably forming a bottom that will become a trading range for several months.
When there is a wedge bottom, especially in a sell climax at a measured move target, there us often a bear breakout below the wedge. In general, there is a 50% chance of a couple legs down to a measured move based on the height of the wedge. Here, because of the sell climax down to support, the odds are instead 60% that the bear breakout will fail and reverse up to test the top of the wedge around 1.3290.
The April 18 – 19 sell climax is strong enough to give the bears a chance at a new low that could last 2 – 3 days, but the odds are that buyers will begin to come in below last week’s low. The bears now have protective stops that are too far and they need to reduce their position size to reduce their risk. As bears take profits, momentum bears will be very quick to get out. The only want to be short if the USDCAD is falling strongly. If it begins to reverse, these bears will quickly buy back their shorts. This usually results in a give up bar within the 1st couple of weeks. That is a big bull trend bar and it indicates that the bears are giving up. They are still happy to sell, but only much higher and after at least a couple of legs up.
The bears are hoping that this current leg will fall all of the way down to last April’s low around 1.1919 before there is a bounce and a trading range. The failed wedge bottom on the daily chart is a sign that the pullback is about to begin within the next couple of weeks. It probably will last at least a couple of months and rally to the March 25 top of the wedge, which is about 600 pips above this week’s low.
The USDCAD is also at its 20 month EMA after having been above it for more than 20 bars (months). Bulls have been willing to buy above an average price for more than 20 months. Many have been waiting for a chance to buy it at an average price. This is a location where bulls will begin to buy. The selloff on the monthly chart is so strong that the 1st reversal up will probably be sold. However, that reversal up could easily extend for 600 pips, which is not even a 50% pullback from the leg down.
The odds are that there will be some news event over the next couple of weeks that will suddenly be very bullish for the USDCAD. This is nonsense. Just because some kid on Paris is eating ice cream on a day when there is a huge rally in the stock market does not mean that his ice cream caused the rally. There is constantly news happening. News reporters believe everything is caused by news. That is an ignorant belief. I know that the odds favor a trading range that will contain at least a 600 pip rally based on what the institutions are telling me. I can see it on the charts. It is purely technical, but very real.
Traders looking for the rally can buy above a bull bar and use a wide stop. It is easier to make money if a trader waits to buy until after he sees a strong bull reversal, like the December 3 bull reversal in the EURUSD.
Summary of today’s S&P Emini futures price action and what to expect tomorrow
I left before the close today. The Emini had follow-through selling on the open, and then had a weak rally from a higher low major trend reversal for the rest of the day.
After initial follow-through selling, the Emini rallied for the rest of the day. The rally was small, and the day was a trending trading range day. On the daily chart, today is a buy signal bar, and the Emini will probably test the July high again.
See the weekly update for a discussion of the price action on the weekly candlestick chart and for what to expect going into next week.
Traders can see the end of the day bar-by-bar price action report by signing up for free at BrooksPriceAction.com. I talk about the detailed S&P Emini futures price action real-time throughout the day in the BrooksPriceAction.com trading room, and a 2 day free trial is available.
When I mention time, it is USA Pacific Standard Time (the Emini day session opens at 6:30 am PST, and closes at 1:15 pm PST). You can read background information on the intraday market reports on the Intraday Market Update page.


I have question regard USDCAD , form the top of the measured move until the target of the measured move down that sell momentum bears we can consider it as a tight bear channel right , if yes you mention in the course when there’s tight bear channel we should only sell , but if we want to buy at least we should Waite for the bear trend line to break and buy at the test of the extreme or lower low or higher low if there good single bull bar. .
it’s the same scenario here or not , because i am confuse when you mention there’s will be at least 600 pip rally to the high of the wedge top . Are you referring the rally will start as higher low after bear trend line broke or the 600 pip rally will be base on the move up that will start from what ever most recent lows that the pair put and reverse form it to way up to break the trend bear line . From where you start to count the rally.
Sorry for the long question.
Hi Nano,
Allow me to answer for Al who already has much work to do.
Al is simply projecting a possibly rally and that rally will only be a rally after it has established itself. Until then, as you note, you should be aware of the tight bear channel and not buy, only sell if you feel it may continue but with measured move down that would be a low probability trade.
So, we need to wait on a price action signal, perhaps a second entry buy, MTR/DB, and then buy. But again, until the rally has established itself we do not have it. The market may go sideways for a while.
Hope that helps.
Thanks Richard for the elaboration.
I appreciate it.
Hello Al .
Welcome back , i hope you are getting well and settling things down, do not worry too much everything going to be fine just work on it and pray for the best to happens.
Thank you for posting the USDCAD like you said it’s very interesting to watch it and learn form it . I am glad you post it .
Hi Dr. Brooks,
Anything on EUR/USD?
regards,
Nili
Not today. I have to limit what I do because I have other things going on in my life right now. I thought that the USDCAD had an interesting setup today.