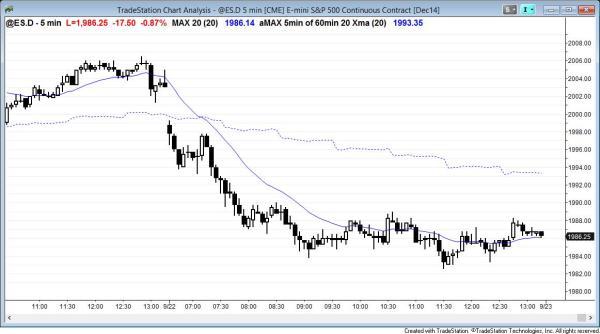
The Emini broke below yesterday’s low and the 60 minute moving average, and then had a trend from the open bear trend. It had trend resumption down after a 10:35 moving average gap bar. This led to a lower low major trend reversal, and more trading range price action.
The Emini had a trend from the open bear trend. It formed a moving average gap bar at 10:35, which made day traders look for a major trend reversal on a test of the low of the day. The reversal up at 11:40 was weak and it failed at a 12:05 double top bear flag. Sixty percent of major trend reversals result in more trading range price action. Only 40% lead to a swing trade. Here, like most of the time, the price action was sideways for the rest of the day.
S&P500 Emini intraday market update for price action day traders
Time of update 7:22 a.m. PST.
The Emini gapped below the 60 minute moving average and broke below yesterday’s low on the open. Day traders say this as a bear trend on the open. The Emini fell 9 points below the open, making a bull trend day unlikely. Also, there were only 2 bull bars in the first 13 bars. At this point, the day will probably be a bear channel or a trading range day. The bulls need a strong bottom or reversal to convert this to long. It might at some point form an endless pullback and channel all of the way back up to the open, so day traders need to watch for that. The rally could last all day, but the day would then more likely become a trading range day. A bull trend day (close well above the open) is unlikely.
Until the bulls start to get consecutive bull trend bars or a strong reversal, bears will sell breakouts, and pullbacks to the middle of the prior bear leg, looking for new lows.
If buying pressure starts to develop (tails below bars, many bull bodies), bulls will begin to scalp below prior lows and scale in, looking for a test of that low.
S&P500 Emini 60 minute, daily, weekly, and monthly candle charts
See the weekly update for a discussion of the weekly chart.
The 60 minute chart has been forming a rising wedge for the past week, and it is nested within a bigger rising wedge since July. About 70% of rising wedges have a bear breakout. Less likely, the pattern will be a head and shoulders bottom bull flag and lead to a measured move up.
Traders can see the end of the day bar-by-bar price action report by signing up for free at BrooksPriceAction.com. I talk about the detailed Emini price action real-time throughout the day in the BrooksPriceAction.com trading room, and a 2 day free trial is available.
When I mention time, it is USA Pacific Standard Time (the Emini day session opens at 6:30 am PST, and closes at 1:15 pm PST). You can read background information on the intraday market reports on the Intraday Market Update page.

