How to trade online after a buy climax: Updated 7:01 a.m.
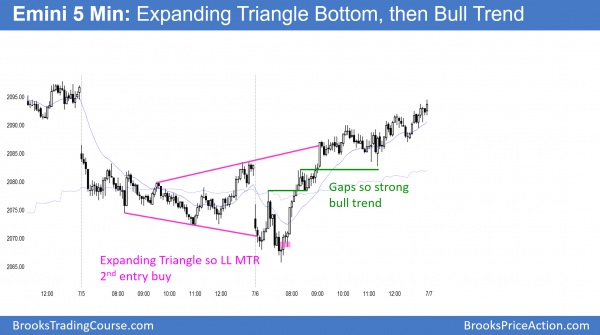
The Emini began with 3 bears bars, like yesterday. The bulls want a reversal up. This would therefore create an expanding triangle bottom. Because of the 3 bear bars, the bulls will probably need a 2nd entry before they can create the low of the day.
At the moment, the Emini is Always In Short, but trying to reverse up. It is around yesterday’s low and yesterday was a trading range. The probability is that that the bulls will try to reverse the bear breakout. The bears are shorting, knowing that they are taking a low probability trade. Yet, the do it because they know that they might get a measuring gap. This would therefore give them a reward that more than offsets the low probability.
There is no bottom yet. The selling has had bad follow-through. The bulls and bears are therefore balanced. Hence, the odds favor a trading range open, which might last 1 – 2 hours. Yesterday was a trading range and the daily chart is in a pullback. This also increases the chances of a lot of trading range price action today. Trading ranges have at least one swing up and down. The Emini is deciding which will come 1st.
As always, any day can become a trend day. The context and early price action today make a trading range day more likely.
How to trade online after a buy climax
S&P 500 Emini: Pre-Open Market Analysis
The Emini yesterday was in a broad bear channel. Late in the day, it reversed up from a Double Bottom Major Trend Reversal. The 60 minute chart also pulled back to its moving average for the 1st time in more than 20 bars. This was a 20 Gap Bar buy setup. As a result, the bulls got their late rally and a close near the high of the day.
While yesterday was a bear trend day, it was the 1st pullback after a strong 4 day rally. The daily chart is also just above its moving average, which is an important magnet. Hence, the Emini probably cannot escape its magnetic pull. This pullback therefore will probably fall at least a little further.
The bears see last week’s rally as a lower high double top with the June 23 high. The bulls see it as the start of a bull flag. As much as this pullback can be deep because it is within a 4 month trading range, it probably will be brief. As a result of last week’s strong buying, this 1st leg down will probably be limited to a a few days. However, the bull flag might ultimately have 2 – 3 legs up and down.
What do the bears need to do?
The bears are fighting a strong rally on the daily chart. As a result, they need one huge bear bar or a series of consecutive bear bars closing below their midpoints. The bull momentum last week makes this unlikely.
In conclusion, while the bears might be able to turn the Emini down from a double top on the daily chart, the odds are against it. Rather, the best they probably will get is a trading range for a few days before the bulls try again for a new high.
Globex trading
The Emini is down 12 points in the Globex market. The day session might open with a small gap down. Since the the selloff from Friday’s high so far looks weak, it is still more likely a bull flag. If the Emini falls below yesterday’s low, there will be a potential 2 day expanding triangle bottom. Therefore, bulls will look to buy a reversal up. They always prefer a 2nd reversal up, like a micro double bottom or a double bottom. This is because the probability of a profitable swing trade is then higher.
The bears want yesterday’s bear channel to continue indefinitely. They know that this is unlikely. However, if they can add enough bars to the pullback, it will become an Endless Pullback. They would then have a 50% chance of a bear breakout below the bear channel and a measured move down.
Forex: Best trading strategies
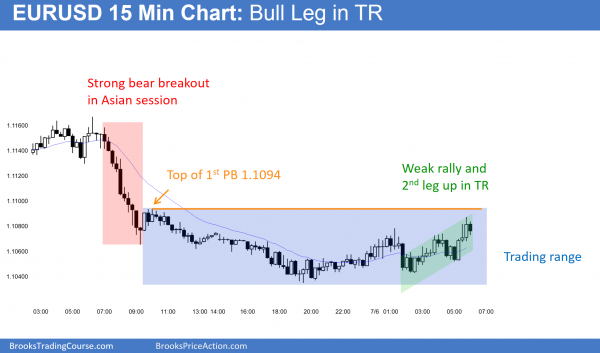
The 15 minute EURUSD Forex chart shows the selloff in the Asian session and the 10 hour trading range. The rally of the past 6 hours is testing the top of the 1st pullback. It is a nested 2 legged rally, and legs within trading ranges usually have 2 legs. This is probably near the top of the range. Hence, the upside is probably limited today.
The daily chart of the EURUSD Forex market had an outside down day yesterday. Furthermore, its high was at the daily moving average and at the top of the 240 minute trading range. I have been writing since the June 24 sell climax that the bulls would probably have a 1 – 3 week rally. They have met the minimum goal.
Since a trading range usually follows a sell climax, the odds are that the EURUSD will go sideways to down to test the 1.1000 area. That is the low of the 1st inside day after the sell climax. Furthermore, since traders expect a trading range, it is an area where bears will take profits and bulls will buy again.
Bear flag on daily chart
While it is possible that the EURUSD Forex chart can break strongly below the bear flag, the odds are against it. The follow-through after the sell climax has been bad, and the sell climax came late in a bear trend. It is therefore more likely an exhaustive end of the trend than a breakout.
Exhaustion usually creates a trading range. If the daily chart goes sideways for 20 or more bars, the bears once again might be willing to sell for a swing trade. At the moment, they are more likely only willing to scalp. This is because they correctly believe that the chart is now in a trading range.
Overnight EURUSD Forex price action
The EURUSD fell sharply for a couple of hours in Asia, and was in a 50 pip trading range since then. The magnet is the 1.1094 top of the 1st pullback from the bear breakout. It rally of the last hour came to within 7 pips. This might be close enough to adequately test the high. However, the rally could easily go a little further before turning down and forming a trading range on the 5 minute chart. Less likely, the bulls will reverse the overnight selloff with a strong bull breakout.
The 10 hour rally on the 5 minute chart had deep pullbacks. The bars mostly overlapped and had big tails on top. It was therefore more likely a rally within a trading range than in an early bull trend. Hence, day traders expect more trading range price action. They will mostly scalp and many will enter with limit orders and scale in.
Summary of today’s S&P Emini futures price action and what to expect tomorrow
The Emini reversed up from a new low of the day and rallied strongly. The 2nd half of the day was mostly sideways, but still in a bull channel. It was an outside up day.
The Emini traded below yesterday’s low, reversed up from the daily moving average, and rallied above yesterday’s high. The bulls want a resumption of last week’s strong bull trend. However, last week had a 60 minute buy climax. Therefore, today’s rally might become the pullback from the 1st leg down. The bears will sell the rally and try to create a 2nd leg down on the 60 minute chart.
This would only add bars to the daily chart’s bull flag. The odds are that the cash index will test its all-time high. As a result, the Emini will probably reach another new all-time high within the next couple of weeks.
See the weekly update for a discussion of the price action on the weekly candlestick chart and for what to expect going into next week.
Traders can see the end of the day bar-by-bar price action report by signing up for free at BrooksPriceAction.com. I talk about the detailed S&P Emini futures price action real-time throughout the day in the BrooksPriceAction.com trading room, and a 2 day free trial is available.
When I mention time, it is USA Pacific Standard Time (the Emini day session opens at 6:30 am PST, and closes at 1:15 pm PST). You can read background information on the intraday market reports on the Intraday Market Update page.


Hi Al,
Based on the 15mins EU chart you have shared, is it correct to label it with LL MTR followed by HL MTR? When I was trading it live, I did not take L1 trade developed between 13:00-14:00. I instead took short on the touch of MA around 17:00. Is that reasonable interpretation of bar counting and would you have taken L1 between 13:00-14:00 if you were trading it live?
Many Thanks
Saad
I am using Pacific time. I suspect you are using EST. In any case, the overnight low was a tight channel without a prior strong rally. Most traders would consider it to be a minor reversal. However, the HL at 2:30 PST was a reasonably MTR. MTRs have a 40% chance of a swing trade. The 7:30 PST LL was also an MTR.
I think selling near the MA was a reasonable trade.
If you are talking about the L1 at 2 pm PST yesterday at the end of the session, it followed 5 consecutive bull bars after a double bottom. I would have waited.