FOMC stock market rally on unchanged interest rates should fail
Updated 6:43 a.m.
While yesterday reversed up from a higher low major trend reversal, just above the July 2015 high, the 1st bar today was a doji within a 3 hour trading range. That 1st doji and the 3 hour range and the magnet below reduce the chances of a strong bull trend. In addition, the uncertainty of the election also increase the chances of mostly trading range trading into the election. Yet, most days will have both a swing up and a swing down. Because trading range price action is likely, the Emini will tend to go above resistance and below support before reversing.
Any day can be a strong trend day. The context today make a strong trend unlikely. Also, this quiet open does as well. Traders will swing if there is a strong breakout up or down. The odds are that any swing will be a leg in a trading range or in a weak trend.
Because yesterday was a double bottom just above major support, a break below yesterday’s low could lead to a huge bear trend day. Yet, the odds are against it. Remember, I have talked many times about the tight trading range double top and the risk of a fast, big move down to 2050. That is still possible over the next week.
Pre-Open Market Analysis
As I mentioned yesterday, the FOMC report would probably not change the market. While the initial selloff tested the 2084.50 July 2015 top of the 2 year trading range, it reversed up from just above. Yet, the odds still favor a break below that support. Furthermore, with the market so close, the odds are the the rally cannot escape the gravitational pull of that strong magnet. Therefore, the Emini will probably trade below it within a couple of weeks. Hence, traders will look to buy the next support, which is the July 6, 2016 low. That was the 1st pullback from the strong July reversal.
Overnight Emini Globex trading
The Emini fell to 2084.00 overnight. That is 2 ticks below the July 2015 top of the 2 year trading range. Some Globex traders will conclude that the closing of the gap will allow a year end rally. Yet, I trade the day session chart and the gap is still open. I do not care what the cash index or Globex chart is doing. I only care about the chart that I trade. Since the gap is still open late in a bull trend, the odds are still that it will close. This is true even if there is a rally beyond the election.
This is what markets typically do. There is never, “The market has changed. It is a new market because of computers and the old rules don’t apply.” Traders have traded logically for centuries. Computers are faster, but trade using the same logic. For 4 months, I have been saying that there was a 70% chance that the gap would close before there was a 300 point measure move up after the strong July bull breakout. That is still true. Therefore, if there is an election rally, it probably will turn down before a new high. Traders want to see a test below support. Hence, the Emini will probably fall to 2040 – 2060, or even lower, before it will rally strongly again.
Forex: Best trading strategies
FXCAPTION
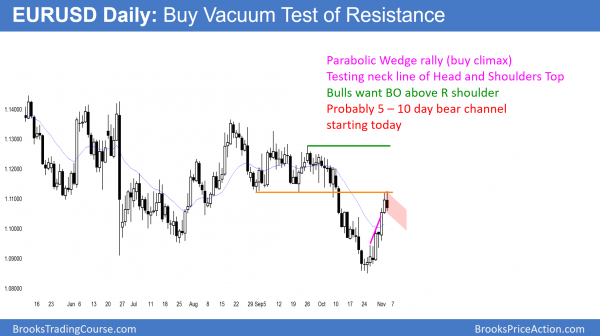
The EURUSD rally is testing the neck line of the October head and shoulders top. Because the rally is a parabolic wedge, it is a buy climax. Therefore there will probably be at least a couple of legs down on the 60 minute chart starting this week. Yet, the reversal up was strong. Hence, bulls will probably buy the 1st reversal down. As a result, the EURUSD chart will probably be mostly sideways for the next week.
Overnight EURUSD Forex trading
The EURUSD Forex rally continued up overnight and tested the October trading range low. Yet, it reversed down 70 pips after a small double top on the 60 minute chart. Because the 8 day rally was a Parabolic Wedge, it was a buy vacuum test of resistance. Furthermore, once a Parabolic Wedge begins to turn down, the selloff is usually in a tight channel and lasts at least 5 days. Since the election is only 4 trading days away, this pullback might end in 4 days. A pullback is a small trading range. Traders are expecting to mostly scalp for a few days, buying low, selling high. In addition, when the range of the past few hours is less than 40 pips, they will often enter with limit orders and scale in.
The bulls will see the pullback as a bull flag on the daily chart. They therefore want a rally above the right shoulder. Since the EURUSD daily chart would no longer be forming lower highs, it would no longer be in a bear trend.
The bears do not mind a rally as long as it reversed down from below the September 26 lower high of 1.1279. They could then argue that the broad bear channel down from the May high is still in effect. Furthermore, they would hope for a bear breakout below the 2 year bear flag on the monthly chart.
Summary of today’s S&P Emini futures price action and what to expect tomorrow
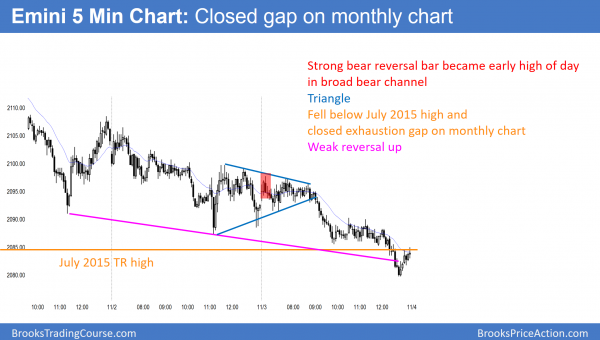
The Emini was in a triangle for 2 hours and then had a Sell The Close bear trend to just above the July 2015 high of 2084.50. It finally closed the gap on the monthly chart in the last hour.
The bears finally closed the 4 month gap on the monthly chart when the Emini fell below the July 2015 high of 2084.50. There was a reversal up from a 3 day wedge bottom at the end of the day. The odds therefore favor sideways to up tomorrow. Even if the Emini rallies into the election, the odds are that it will test lower support in the 2040 – 2060 area before the bulls will buy aggressively.
See the weekly update for a discussion of the price action on the weekly candlestick chart and for what to expect going into next week.
Traders can see the end of the day bar-by-bar price action report by signing up for free at BrooksPriceAction.com. I talk about the detailed S&P Emini futures price action real-time throughout the day in the BrooksPriceAction.com trading room. We offer a 2 day free trial.
When I mention time, it is USA Pacific Standard Time (the Emini day session opens at 6:30 am PST, and closes at 1:15 pm PST). You can read background information on the intraday market reports on the Intraday Market Update page.


