FOMC next week is more important to Emini traders than hurricanes
Updated 6:40 a.m.
The Emini opened within yesterday’s range. In addition, yesterday was a trading range day. Finally, after 2 bull days in a broad bull channel, the odds are that today will be a disappointing day for the bulls. Therefore, the odds are against a strong bull day.
Yet, consecutive bull days is a sign of strong bulls. Therefore, the odds are against a strong bear day. That leaves a trading range day as the most likely outcome for today. Trading range days typically have at least one swing up and one down, and the swings usually last 2 – 3 hours. The Emini is now deciding whether the 1st swing will be up or down.
While any day can be a big trend day, the context is against that today.
Pre-Open market analysis
The Emini had a trading range day yesterday after Monday’s breakout to a new high. The 2500 Big Round Number is a magnet above. Since the momentum up is reasonably good, the odds are that the Emini will trade above 2500 within a week.
The daily chart has 3 legs up from the August low on the daily chart. It is therefore a wedge rally. If there is a reversal setup soon, the bears will sell, looking for a couple of legs down. The pattern would be a higher high major trend reversal and an expanding triangle top. The Emini is also near the top of its 7 month bull channel.
Because Monday’s rally was followed by a trading range yesterday, today will probably not be strongly bullish. In addition, yesterday’s lack of follow-through increases the chances of a 1 – 2 day pullback today or tomorrow.
Broad bull channel
Since the Emini has been in a broad bull channel over the past 7 months, it has a lot of trading range behavior. Consequently, strong bull breakouts usually have disappointing follow-through. Therefore, after 2 good bull days on the daily chart, the odds are that today will either be a small bear day or a trading range day.
Overnight Emini Globex trading
The Emini is down 4 points in the Globex market. This is consistent with the daily chart being in a broad bull channel. The odds of a 3rd consecutive strong bull day are less than those for either a small bear day or a doji day. A small down open would be consistent with this.
Yesterday’s setups
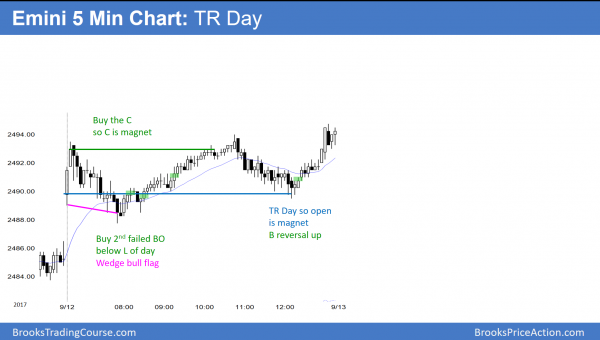
Here are several reasonable stop entry setups from yesterday. I sometimes also show limit order entries and entries on the close of bars.
EURUSD Forex market trading strategies
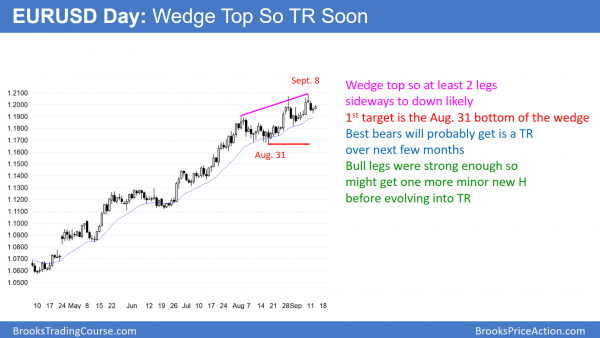
The EURUSD daily Forex chart bounce overnight after Monday’s 1st leg down from the wedge top. The odds are that the chart is transitioning into a trading range over the next month or two.
The EURUSD daily Forex chart reversed down on Monday from a wedge top. The wedge has a good shape. In addition, it is at resistance on the monthly chart. Furthermore, the 7 month rally is in a tight bull channel and is therefore climactic. The 2nd and 3rd legs up in the wedge bull channel were strong. That increases the chances of 1 more minor new high before the daily chart transitions into a trading range. While the bull trend can continue much higher, these facts make a pullback likely over the next month or two.
Since the pullbacks from the 2nd and 3rd tops of the wedge lasted only a couple of days, the wedge is small. Any reversal down will therefore probably be minor. This means that the best the bears can probably get is a trading range over the next few months.
However, if there is a strong break below the August 31 bottom of the wedge, the pullback could fall for a measured move down. That would therefore be a 50% pullback. In addition, it would be a test of the top of the 2 year trading range at around 1.1600. Yet, the odds still would favor a trading range, albeit big, rather than a bear trend.
Overnight EURUSD Forex trading
The 5 minute chart traded in a 30 pip range overnight. Therefore day traders are scalping. Since there is a wedge top on the daily chart, the overnight rally will probably form a lower high. This is because even a small reversal down from a wedge top usually has at least a small 2nd leg sideways to down. As a result, swing traders on the 5 minute chart will sell this rally, looking for a test of yesterday’s low. In addition, that would be a test f the 20 day exponential moving average.
Summary of today’s S&P Emini futures price action and what to expect tomorrow
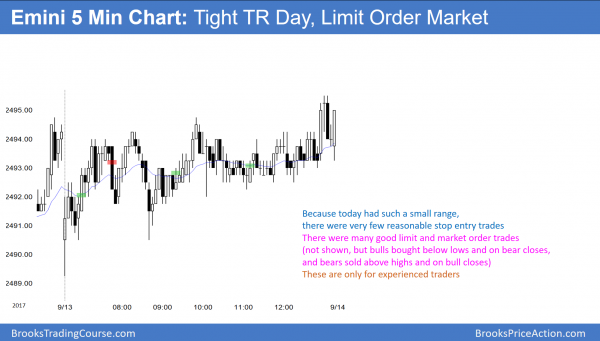
Since the Emini was in a small trading range today, there were very few reasonable trades for beginners.
Today was the 3rd consecutive day with mostly trading range price action. It is therefore in breakout mode going into next week’s FOMC announcement.
See the weekly update for a discussion of the price action on the weekly candlestick chart and for what to expect going into next week.
Traders can see the end of the day bar-by-bar price action report by signing up for free at BrooksPriceAction.com. I talk about the detailed S&P Emini futures price action real-time throughout the day in the BrooksPriceAction.com trading room. We offer a 2 day free trial.
When I mention time, it is USA Pacific Standard Time (the Emini day session opens at 6:30 am PST, and closes at 1:15 pm PST). You can read background information on the intraday market reports on the Intraday Market Update page.


