Emini weekly High 1 bull flag below all time high
I will update again at the end of the day.
Pre-Open market analysis
Last week closed near its high. Therefore, the candlestick on the weekly chart is a High 1 buy signal bar for this week. If this week trades above last week’s high, it will trigger the buy signal. The odds continue to favor a new all time high within a month or so. It might even come this week. However, the past 5 bars on the weekly chart have had small bodies, prominent tails, and several reversals. This is not yet a strong attempt at a new high.
Overnight Emini Globex trading
The Emini is up 3 points in the Globex session. It might gap above Friday’s high. If so, the gap will be small and it will probably close in the 1st hour.
Last week was a 1 week pullback in a Small Pullback Bull Trend. In addition, it was a bull candlestick bar that closed on its high. It is therefore a High 1 bull flag and a buy signal bar for this week. Since today will open near last week’s high, today will probably trigger the weekly buy signal by going above last week’s high.
However, the daily chart has had lots of bars with tails on top over the past 2 weeks. This hesitation reduces the chances of a strong bull entry bar on the weekly chart this week. Furthermore, the 3 day rally is forming a wedge bull channel on the 60 minute chart. This increases the chance of the rally stalling near the high of 2 weeks ago. That high is the top of a 4 week trading range.
Because the daily chart is close to the January all-time high, there is an increased chance of a strong breakout to a new high this week. Therefore, traders will be ready for a one or more big bull trend days. But, whenever a market is at resistance, there is also an increased chance of a reversal down and a big bear trend day. Since the past 5 days have had relatively big ranges, the odds are that today will also have at least one 10 point swing up or down.
Friday’s setups
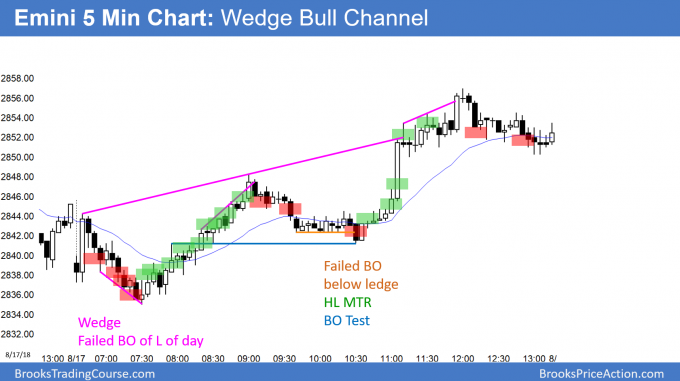
Here are several reasonable stop entry setups from Friday. I sometimes also show limit order entries and entries on the close of bars. My goal with these charts is to present an Always In perspective. If a trader was trying to be Always In or nearly Always In a position all day, and he was not in a position at the moment, these entries would be logical times for him to enter.
EURUSD daily Forex breakout test after Final Bear Flag
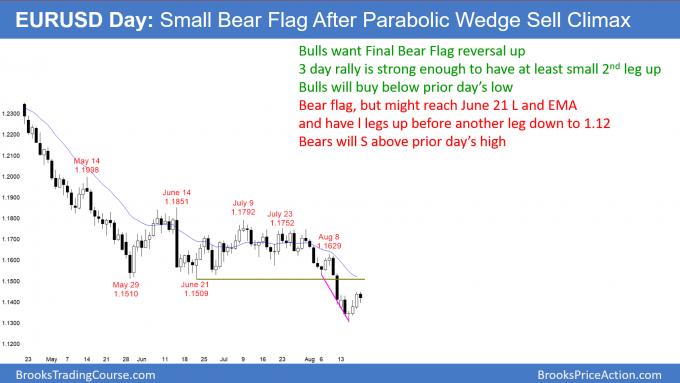
The EURUSD daily Forex chart has rallied for 4 days after breaking below a 3 month trading range in a bear trend. This is probably a breakout test of the June 21 low. It is strong enough for 2 legs sideways to up over the next week or two.
The EURUSD daily Forex chart had a big bull day on Friday. Today is the 4th day in an attempted bull trend reversal. However, the 3 week breakout was very strong. In addition, there is a measured move target below at around 1.12. Therefore, this rally is probably a minor reversal. The bears will sell at resistance near the 1.15 trading range bottom and the 20 day EMA.
The odds are that the rally will fail after about 2 weeks of sideways to up trading. The bears will begin to sell above prior day highs, betting that the bulls will use those highs to take profits. But, the bulls will buy below the prior day’s low because they are confident that the rally will have at least 2 legs and reach the magnets above. With traders buying dips and selling rallies, this 4 day rally will turn into a trading range or a bear flag.
EURUSD weekly buy signal bar
Last week was a strong bull reversal bar on the weekly chart. It is therefore a buy signal bar for this week. But a bull candlestick pattern is not enough. Traders always have to look at context, which means the bars to the left. Since it is following 3 strong bear bars and there is a measured move target below, there is only a 30% chance that last week is the start of a bull trend. The bulls usually need at least a small double bottom on the daily chart. That would require a test of last week’s low. Alternatively, if they can create a series of bull trend bars and get closes above 1.15, traders will begin to believe that the bear trend has reversed up.
Overnight EURUSD Forex trading
The EURUSD 5 minute Forex chart traded down 50 pip overnight after going 2 pips above Friday’s high. This is trading range price action. Since at least 2 legs sideways to up are likely over the next 1 – 2 weeks, traders will look for reversals after every 50 – 100 pip move.
The bars overnight were small, and they had lots of overlap and prominent tails. This usually leads to a quiet day. Day traders therefore will probably scalp for 10 – 20 pips today. In addition, they will use limit orders above and below the prior day’s range betting on reversals.
Summary of today’s S&P Emini futures price action and what to expect tomorrow
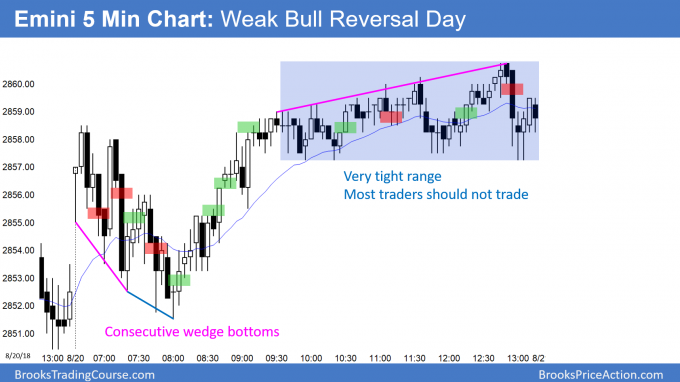
Here are several reasonable stop entry setups for today. I sometimes also show limit order entries and entries on the close of bars. My goal with these charts is to present an Always In perspective. If a trader was trying to be Always In or nearly Always In a position all day, and he was not in a position at the moment, these entries would be logical times for him to enter.
By trading above last week’s high, the Emini triggered a buy signal on the weekly chart. Even though today was a bull reversal day, it was mostly a trading range day. It spent 4 hours in a 3 point range. The open of the day is always a magnet during a trading range day, and today closed near the open.
The bulls need to break above the top of the 4 week trading range before they can make a new all-time high. That top was 2 weeks ago.
The bears will try to create a double top with that high. However, they need a strong reversal down this week to convince traders that they will be able to trade down to the neck line of the 2 week double top. That is last week’s low. More likely, legs up and down will continue to reverse every few days.
See the weekly update for a discussion of the price action on the weekly candlestick chart and for what to expect going into next week.
Traders can see the end of the day bar-by-bar price action report by signing up for free at BrooksPriceAction.com. I talk about the detailed S&P Emini futures price action real-time throughout the day in the BrooksPriceAction.com trading room. We offer a 2 day free trial.
When I mention time, it is USA Pacific Standard Time (the Emini day session opens at 6:30 am PST, and closes at 1:15 pm PST). You can read background information on the intraday market reports on the Intraday Market Update page.


