Emini weekly gap up to new all time high on NAFTA
I will update again at the end of the day.
Pre-Open market analysis
The Emini gapped up to a new all-time high yesterday on the daily and weekly charts. While the news will attribute this to a possible NAFTA deal, it is mostly technical. I said last week that this week might gap up based on the strong momentum up. There is news every day. That is not what caused the breakout. Last year was strongly bullish. Exhausted bulls took profits in February. They have been buying since April, and have been buying aggressively for 8 weeks.
When there is a big gap above resistance, the Emini usually goes sideways for 2 – 4 days. However, the bull trend then usually resumes once it is clear that the bears will fail to create a reversal. Therefore, the odds favor higher prices. This is especially true since August 30 to September 5 is seasonally bullish as well.
Overnight Emini Globex trading
The Emini is up 3 points in the Globex session. It might gap up above the 2900 Big Round Number. If the gap is small, it probably will close in the 1st hour.
Because the Emini broke above major resistance, there is an increased chance of a big trend day up or down. But, a breakout above major resistance usually leads to a pause for 2 – 4 days. Traders then decide if the breakout will continue or reverse. Also, yesterday was in a tight range for most of the day. Therefore, the odds are that today will probably be mostly sideways again.
Yesterday’s setups
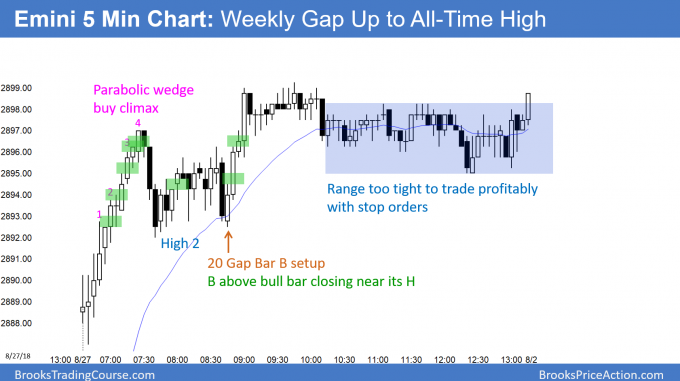
Here are several reasonable stop entry setups from yesterday. I sometimes also show limit order entries and entries on the close of bars. My goal with these charts is to present an Always In perspective. If a trader was trying to be Always In or nearly Always In a position all day, and he was not in a position at the moment, these entries would be logical times for him to enter.
EURUSD Forex buy climax near resistance at apex of triangle
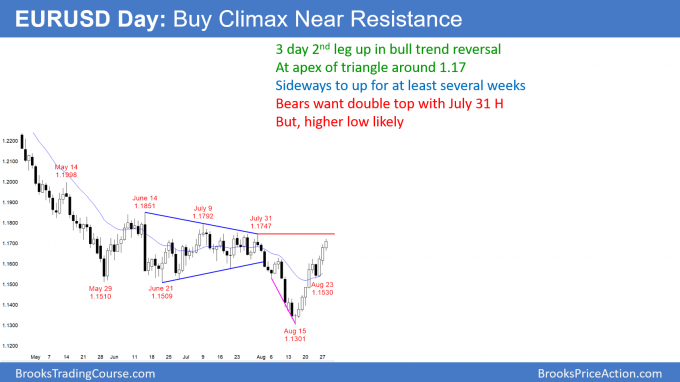
The EURUSD daily Forex chart has rallied for 3 days in a 2nd leg up after a bull trend reversal. It is now testing resistance at the apex of the triangle. The odds favor a trading range before a breakout above the June 14 high.
The EURUSD daily Forex chart has rallied strongly for 3 weeks. This is a bull trend reversal. However, the rally is back to the apex of the 2 month triangle, which was a magnet and therefore resistance. Furthermore, the daily chart was sideways for 3 months around 1.17. In addition, it is now testing the 20 week EMA. Finally, the June 14 top of the 3 month trading range is resistance. Therefore, the odds are that this rally will stall this week and begin to enter a trading range for at least a couple of weeks.
Less likely, the rally will continue up and break strongly above the 1.1850 top of the 3 month trading range. While that breakout is likely within a few months, the daily chart will probably have to go sideways for at least a few weeks first.
The bears want a lower high below the June 14 or July 31 highs. They then want a break to a new low below 1.13. They only have a 30% chance of success at the moment. Since the rally was strong and the context is good for the bulls, the odds are that any selloff will form a higher low. The best the bears will get is a bear leg in a trading range or in a bull channel.
Overnight EURUSD Forex trading
The EURUSD 5 minute chart rallied 50 pips overnight. It is now at the apex of the 2 month trading range. Also, the 60 minute chart is at the top of a wedge. The odds are that the rally will stall around here for a couple of days. The bears will probably need a double top on the 60 minute chart. Then, there will probably be a 100 – 150 pip pullback for a few days.
Since the rally is climactic and a pullback is likely soon, the bears will begin to sell this rally. Because the downside is limited, the bulls will buy selloffs, especially down to the August 23 low at the 20 day EMA at around 1.15.
Summary of today’s S&P Emini futures price action and what to expect tomorrow
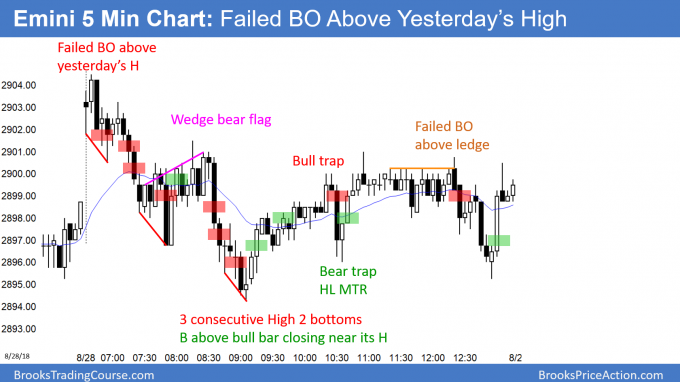
Here are several reasonable stop entry setups for today. I sometimes also show limit order entries and entries on the close of bars. My goal with these charts is to present an Always In perspective. If a trader was trying to be Always In or nearly Always In a position all day, and he was not in a position at the moment, these entries would be logical times for him to enter.
The Emini gapped above yesterday’s high and the 2900 Big Round Number. It then reversed back down into yesterday’s tight trading range. This reversal is probably minor, but it could last another day or two.
Since today has a bear body on the daily chart, it is a sell signal bar for tomorrow. But, the bull channel over the past 3 weeks is tight. Therefore, the bears will probably need at least a micro double top before they can get a swing down. Consequently, there will likely be more buyers than sellers below today’s low.
If tomorrow gaps down, there would then be a 2 day island top at the all-time high. While this is bearish, island tops and bottoms only rarely lead to big moves.
See the weekly update for a discussion of the price action on the weekly candlestick chart and for what to expect going into next week.
Traders can see the end of the day bar-by-bar price action report by signing up for free at BrooksPriceAction.com. I talk about the detailed S&P Emini futures price action real-time throughout the day in the BrooksPriceAction.com trading room. We offer a 2 day free trial.
When I mention time, it is USA Pacific Standard Time (the Emini day session opens at 6:30 am PST, and closes at 1:15 pm PST). You can read background information on the intraday market reports on the Intraday Market Update page.


