Emini weekly candlestick chart creating weak sell signal for next week
I will update again at the end of the day
Pre-Open market analysis
After Wednesday’s big outside down day, yesterday was an inside day and a trading range day. It is therefore both a buy and sell signal bar for today on the daily chart. Since it is at the top of a 4 day tight trading range and Wednesday was a big bear day, it is not a strong buy setup. Because the 3 week bull channel is tight, it is not a strong sell setup. Therefore, the odds are for more sideways trading again today. However, after 3 consecutive bear days, traders will be ready for more bear days over the next couple of weeks.
The range this week has been small. If the week closes below the open, the candle stick on the weekly chart will have a bear body. That would make it a sell signal bar for next week. The daily chart is just below the March high and the 2800 Big Round Number. A selloff from here would therefore create a lower high double top.
But, the 3 week rally has been strong in a tight bull channel. Consequently, the odds are against a big, fast selloff. If this is the start of a 2 – 3 week bear leg down to the May 29 low, it will probably be gradual, like the selloffs from the April 18 and May 14 highs. Any selloff will more likely be a bear leg in the 5 months trading range than a resumption of February’s bear trend.
Overnight Emini Globex trading
The Emini is down 14 points in the Globex session. It might therefore gap down below yesterday’s low. However, there is a wedge rally, a lower high double top, and a buy climax on the daily chart. Hence, there is an increased chance of a 2 – 3 week selloff down to the May 29 low. Therefore, there is an increased chance of a preponderance of bear days over the next couple of weeks.
Will there be small early rallies that reverse down and late selloffs that lead to closes near the low over the next week? If so, day traders will conclude that the daily chart has begun a swing down. They will therefore look for this pattern to repeat most days and create many bear days.
Yesterday’s setups
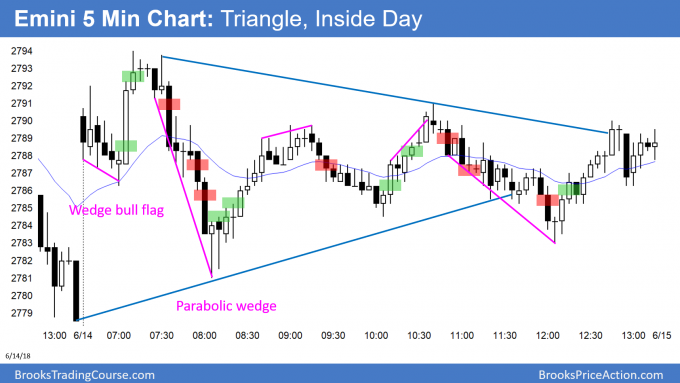
Here are several reasonable stop entry setups from yesterday. I sometimes also show limit order entries and entries on the close of bars.
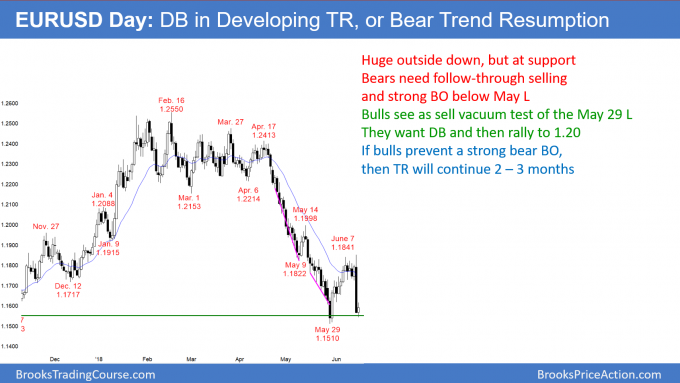
EURUSD Forex sell vacuum test of support and double bottom major trend reversal
The EURUSD daily Forex chart had a huge bear day yesterday. While the bears hope that this is a resumption of the bear trend, they need strong follow-through selling over the next 2 weeks. Otherwise, yesterday will simply be a sharp sell vacuum test of support. The bulls will try for a double bottom major trend reversal.
The EURUSD daily Forex chart had a dramatically big bear day yesterday. It was an outside down day, and the week is now outside down as well. But, there were consecutive sell climaxes down to support on May 29. Therefore, the odds still favor a trading range that will last at least a couple of months. Yesterday’s momentum down increased the odds of a strong break below the May low and a 300 pip measured move down to around 1.12. However, unless the bears get strong follow-through selling over the next 3 weeks, yesterday will soon reverse up from around the May low.
If the daily chart begins to turn up over the next few weeks, the bulls would have a major trend reversal. Last week’s high is the neck line of the double bottom. A breakout above would lead to a test of the May 14 high at around 1.20.
Overnight EURUSD Forex trading
The EURUSD 5 minute Forex chart had a big bear trend day yesterday. However, there was no overnight follow-through selling. Instead, the market traded in a 50 pip range. In addition, the odds are that the daily chart is now in a trading range, despite yesterday’s big bear trend on the 5 minute chart. If the bulls can prevent a strong selloff over the next few days, traders will begin to see yesterday as a test of the May low. The bulls will look for buy setups for a rally back up to the June high.
Because yesterday was as strong bear trend day, the bears have an increased chance of follow-through selling over the next several weeks. But, the odds still are greater that the daily chart is in a trading range.
EURUSD Forex Day traders choosing between probability and risk/reward
Trading is always a choice between probability and risk/reward. The momentum down favors the bears on the 5 minute chart, which means it is likely that there will be at least a small 2nd leg down over the next week. But, the risk/reward favors the bulls. The bulls do not need to risk much below the May low in their attempt to make 400 pips up to the May high. They will bet that the 2nd leg down will be brief and small and form a micro double bottom with yesterday’s low.
Yesterday’s big move down slightly lowers the probability of a trading range on the daily chart, but a trading range is still likely. Yesterday therefore created confusion, and confusion usually results in at least a small trading range. Therefore, the odds are that the 5 minute chart will go sideways for a few days.
Less likely, yesterday will be a resumption of the bear trend on the daily chart and the start of many big bear days. What if those bear days do not appear? Traders will conclude that yesterday was just a strong bear leg in a developing trading range. They will therefore buy, expecting a 2 – 3 week bull leg in the range.
Summary of today’s S&P Emini futures price action and what to expect tomorrow
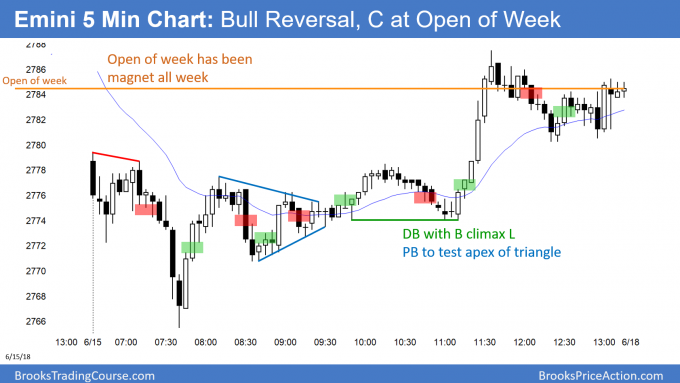
The Emini sold off on the open and then reversed up. With a late rally, it closed exactly at the open of the week.
By trading below yesterday’s low, the daily chart triggered a sell signal. There was a wedge rally since the April 18 high, and a lower high double top with the March high. However, the daily chart has been in a trading range for 5 months. Therefore, even if there is a selloff for 2 weeks, it will more likely be a bear leg in the trading range than a bear trend.
Since this week is a doji bar on the weekly chart, it is a weak sell signal bar.
See the weekly update for a discussion of the price action on the weekly candlestick chart and for what to expect going into next week.
Traders can see the end of the day bar-by-bar price action report by signing up for free at BrooksPriceAction.com. I talk about the detailed S&P Emini futures price action real-time throughout the day in the BrooksPriceAction.com trading room. We offer a 2 day free trial.
When I mention time, it is USA Pacific Standard Time (the Emini day session opens at 6:30 am PST, and closes at 1:15 pm PST). You can read background information on the intraday market reports on the Intraday Market Update page.


Hi Al,
I understand that after all day trading and commenting it would be difficult to spent too much time marking the chart with entry,
but it appears to me that most of the entries, which you mark are too early with possibility of the other side to succeed.
Please do not take this as critisism, but as my learning curve.
For example:
a) bar 8 selling the low. Sure context is there and price proved it by hitting target, but bulls could easily have DB H2 on bar 10.
b) bar 26, again sure all reasons were there, but that little information, when 28 failed to form L2 and 2nd leg down everyone bought on bar 29.
It looks to me being better off to wait for failure of the other side rather than excepting only signal in direction of possible
move from context.
for example: I sold low 22 and exposed myself to H2, which never triggered, but selling bulls failure below the low (where you marked it was much better trade).
I appreciate your time and effort helping other traders.
thank you
I think you are missing the whole point of Al’s chart markups. Al is pointing out REASONABLE entries…notice I didn’t say GUARANTEED entries.
As Al has stated thousands of times, there is always a reason for the other side also enter, and there is only clarity during strong breakouts.
Perhaps you would benefit from reviewing the bar-by-bar analysis that Al posts on the BrooksPriceAction.com website. He goes into more detail there.
maybe, not sure:)
but there is not really clarity of strong BO yet, if you sell below bull bar 23 till, bar closes. You need to understand what just happened.
I know there is always reason for bulls and bears and that makes trading challenge, sure.
I am not sure I captured precisely, what i am trying to point out.
It`s very good point you made, that Al is pointing out reasonable entries not guaranteed.
I was thinking, when I wrote that question, if I am looking for certainty, which psychologicky means avoiding risk and I do not think so.
I am asking from point of reading PA.
Hey Jiri – if you are failing to take reasonable trades that meet your edge, there is no question… it is your trading psychology.
Hi Al,
could you pls give some inside on short below bar 22, which found limit buyers?
thank you
I assume you mean today’s chart. There were not many sellers below 21, and they quickly decided that the took a bad sell. They bought back their shorts. There were not many bulls buying. Stronger bears took the 2nd sell signal, below 23.
While 22 was the 2nd bear bar, it was still a continuation of the Low 1 short below 21. Yes, the rally was a parabolic wedge, but it was strong enough so that most bears wanted a 2nd entry. That means that the 1st entry below 21 or 22 was likely to have buyers below. 23 was an outside up bar. Once the Emini fell below its low, that was the 2nd entry. You can see the big bear bar 24. That is a sign that lots of traders wanted a 2nd entry sell signal.
thank you,
I sold 22 and managed to get 2 points, but was not it already 2nd entry below this bear bar 22?
oh ok, I can see it now ( as you say 22 continuation of L1 after strong up was surely still low prob.) thank you