Emini weak bull breakout of triangle on strong earnings reports
I will update again at the end of the day
Pre-Open market analysis
The Emini had a weak bull trend yesterday. However, the rally broke above the top of the 4 week trading range. A weak rally can still lead to a big bull trend if there is follow-through buying. Therefore, the bulls need more trend days this week. If they get them, then the move back to 2800 will likely be underway. A gap up any day this week will create a 4 week island bottom. If the gap were to stay open for a few days, the rally would probably continue up to 2800. The chart is becoming increasingly likely to be entering a bull trend.
The bears need a strong selloff this week. That means at least a couple consecutive bear days closing near their lows. At a minimum, they want today to have a bear body. It would therefore be a bad follow-through day for the bulls and reduce the chances of a continuation of the 3 week rally.
Overnight Emini Globex trading
The Emini is up 16 points in the Globex session. Therefore, today will probably open with a gap up. If the bulls can prevent the gap from closing, today’s gap up will have created a 3 week island bottom. An island bottom is a sign of strong bulls.
The odds would then favor a resumption of the bull trend on the monthly chart. Therefore, there would be an increased chance of a series of bull trend days over the next 2 weeks. Consequently, traders will be more inclined to look for an early low of the day each day. For example, if the Emini sells off on the open, the bulls will look to buy a reversal up, expecting a bull trend day.
The bears are losing control. They need to reverse this rally within the next couple of days. If they cannot close the gap and get a couple big bear days this week, then the 3 month correction is probably over. The odds now favor the bulls, and the bears are running out of time.
Yesterday’s setups
Here are several reasonable stop entry setups from yesterday. I sometimes also show limit order entries and entries on the close of bars.
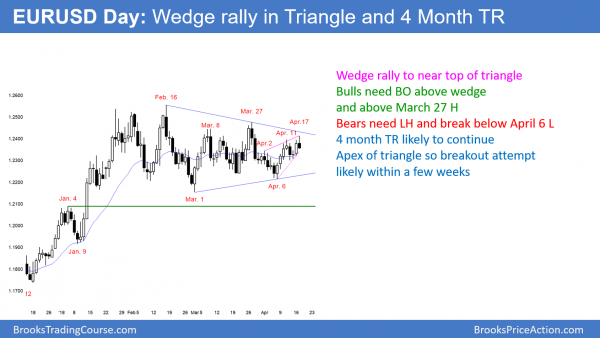
EURUSD wedge rally in triangle
The 2 week rally is turning down from the bear trend line at the top of the 3 month triangle. Furthermore, the rally is a wedge, which increases the chance of 2 legs down.
The EURUSD daily Forex chart has been in a triangle for 3 months. It turned down overnight from a wedge rally that began on April 2. If today closes near its low, it will be a sell signal bar for tomorrow. Traders will then look for 2 legs down over the next couple of weeks.
Since the daily chart has been sideways for 4 months, there have been many buy and sell signals. Yet, despite how strong the legs were, all of the breakout attempts have failed. This is because markets have inertia. They have a strong tendency to keep doing what they have been doing. Consequently, the wedge top is unlikely to lead to a bear break below the range. Traders will continue to take profits after 1 – 2 weeks.
However, the trading range is now in a triangle. The range is getting tight. That increases the chances of a breakout within the next few weeks. The 1st breakout has a 50% chance of failing and reversing. Once there is a successful breakout, there is a 50% chance it will be up and a 50% chance it will be down.
Overnight EURUSD Forex trading
The EURUSD 5 minute Forex chart reversed down more than 60 pips overnight. If today simply goes sideways here, today will be a bear reversal bar on the daily chart. The reversal down was from a wedge and near a bear trend line on the daily chart. If today closes near its low, today would be a strong sell signal bar for tomorrow on the daily chart.
However, if today rallies about 30 pips by the end of the US session, the bar on the daily chart will have a big tail below. This will lower the probability of a swing down over the next 2 weeks. Instead, the chart will more likely go sideways for at least 1 – 2 more days.
The momentum down overnight has been good. However, the final leg down on the 5 minute chart was from a 2 hour wedge bear flag. That will probably be the Final Bear Flag. Therefore, the odds are that the next couple of hours will enter a trading range.
The target for the bulls is the top of the bear flag, which is up about 30 pips. If today closes there, the bulls will have weakened the daily sell signal bar. Tomorrow will then probably be sideways.
Alternatively, whether or not there is a 30 pip rally, if the bears can make today close near its low, tomorrow will probably trade down. While the overnight selloff has been in a tight bear channel, it is more likely to transition into a trading range after the wedge bear flag than to continue all day.
Summary of today’s S&P Emini futures price action and what to expect tomorrow
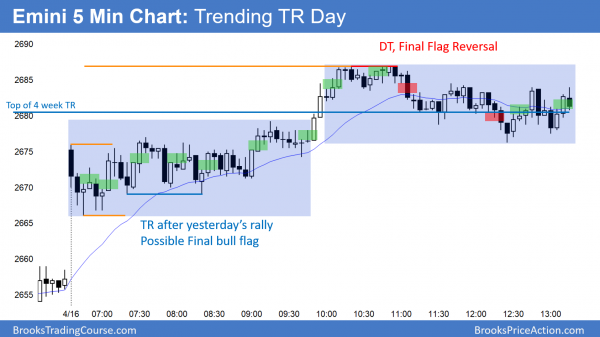
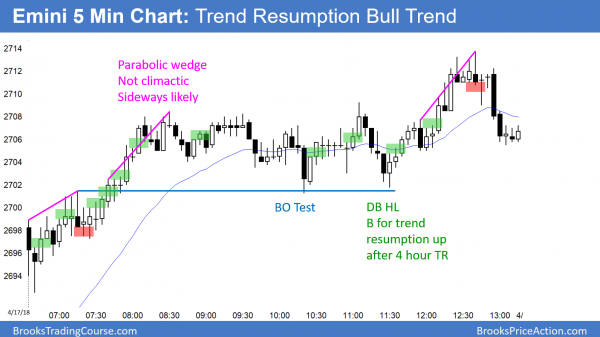
The Emini gapped up on the daily chart and created a month-long island bottom. It was a bull trend resumption day, and it closed the March 22 gap on the daily chart.
The Emini gapped up and rallied in a trend from the open bull trend. After a trading range, the bull trend resumed. The odds are that the Emini will continue up to 2800 over the next few weeks.
See the weekly update for a discussion of the price action on the weekly candlestick chart and for what to expect going into next week.
Traders can see the end of the day bar-by-bar price action report by signing up for free at BrooksPriceAction.com. I talk about the detailed S&P Emini futures price action real-time throughout the day in the BrooksPriceAction.com trading room. We offer a 2 day free trial.
When I mention time, it is USA Pacific Standard Time (the Emini day session opens at 6:30 am PST, and closes at 1:15 pm PST). You can read background information on the intraday market reports on the Intraday Market Update page.


Hi AL,
for bar 52– you said the chart is in a bear CH but AIL
did you mean it was better to look to buy
& the probability to BO to HOD is greater than to new L
Thank you
Yes, when I say that a chart is Always In Long, that is exactly what I mean. Any reversal will likely be a bull flag instead of the start of a bear trend. Therefore, traders will look to buy. Bar 5 2 was the 4th doji and in a 7 bar bull micro channel. Bar 53 was therefore a small Cup and Handle buy setup from the Bar 47 reversal up.