Posted 6:50 a.m.
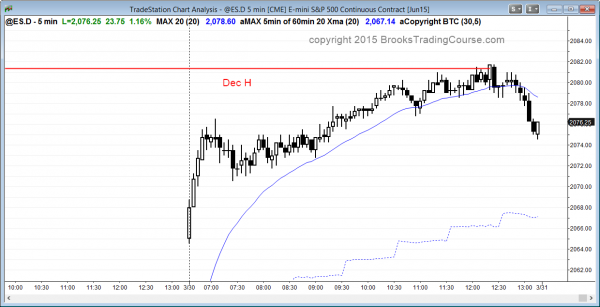
The Emini opened with a big gap up and a bull breakout, and continued the always in long rally from early Friday. The bears need either a trading range to generate selling pressure or a parabolic wedge top. There is no evidence of either yet. Until then, bulls will swing and scalp, and they will bull pullbacks.
When there is a strong rally like this on the open, the market usually begins to enter a trading range within an hour, and it might then stay in that range for several hours. Later in the day, it chooses between trend resumption up and trend reversal down.
At the moment, the Emini is always in long and there is no sign of a top. Bulls will continue to buy for any reason and bears will wait for signs of selling pressure or exhaustion before shorting. Although it is possible that this is a buy vacuum test of the middle of last week’s measuring gap, it is too early to consider shorting.
Because the Emini has been in a trading range for 2 days and it is within the trading range of the past 2 months, traders are hesitant to buy too high and to hold onto positions for too long. Their basic thought is the buy low, sell high, and scalp. However, there are often swing trades within trading ranges, and this opening rally is one.
My thoughts before the open: Trading range and in breakout mode
The Emini daily and 60 minute charts are each in a trading range and in breakout mode. They both have double tops and double bottoms, and the 2nd top is slightly lower and the 2nd bottom is slightly higher. This is probably a triangle. The sell off last week was so strong that the first reversal up will probably pull back before the market breaks to a new all-time high, if the bulls get their breakout. In either case, traders expect a measured move up or down.
The bulls want a test of at least the middle of last week’s leg down. The bears were unable to break strongly below the early March higher low and they do not mind the test up, as long as it forms a lower high and is followed by a breakout below the double bottom.
The bears see the rally of the last 2 days as a bear flag, but today will probably gap up and create a bull breakout above the bear flag. Traders learning how to trade the markets should be aware that this could lead to a measured move up. However, unless the rally is strong, it will probably be just another leg in the March trading range.
Even if the bears get their breakout below last week’s low, a failed breakout would create a big high 2 buy setup on the daily chart.
Tomorrow is important because it is the last trading day of the month and it therefore affects the appearance of the monthly candle. The bears want a strong sell signal bar (a bear ioi with the bar closing on its low). The bulls want a weak sell signal so that there will be buyers below and above.
Summary of today’s price action and what to expect tomorrow
The Emini gapped up and rallied. The day became a spike and channel bull trend and failed on its test of the December high.
Tomorrow is the last day of the month and the month’s candle is inside last month’s, and is part of an ioi breakout mode setup. Tomorrow determines the strength of the monthly candle. The bulls want a close above the midpoint so that they can claim that the month closed in its upper half, which is bullish. The bear want a close on the low of the month. Since that is 40 points below today’s close, it is unlikely. Their next goal is a close below the midpoint of the month at 2068.88 so that the bulls do not have a sign of strength.
With today failing at the December high and with today rallying above the midpoint of the month, tomorrow might trade within that range for much of the day. However, because it is the end of the month, one side might take control in the final hour or so. If the bulls win and the month closes near its high, the monthly ioi then becomes a buy signal bar. With the monthly chart as overbought as it is, if the buy triggers in April by going above the March high, the ioi will probably become the final small bull flag before the correction down to the October low begins. Less likely, the monthly bull trend will continue for many more bars.
See the weekly update for a discussion of the weekly chart and for what to expect going into next week.
Traders can see the end of the day bar-by-bar price action report by signing up for free at BrooksPriceAction.com. I talk about the detailed Emini price action real-time throughout the day in the BrooksPriceAction.com trading room, and a 2 day free trial is available.
When I mention time, it is USA Pacific Standard Time (the Emini day session opens at 6:30 am PST, and closes at 1:15 pm PST). You can read background information on the intraday market reports on the Intraday Market Update page.


