Emini unlikely to create outside up candlestick on weekly chart
I will update again at the end of the day.
Pre-Open market analysis
The Emini gapped up yesterday and created a 1 day island bottom. While yesterday was a bull trend day, it closed below its high. But, the momentum up good enough to make traders believe that the 6 day pullback has ended. However, the bulls need to get above the August high.
Today is the last day of the week. If it is a big bull trend day, it could get above last week’s high. This week would then be an outside up bar on the weekly chart. While unlikely, that would be a sign of strong bulls and increase the odds of a new all-time high soon.
The other weekly magnet is the open of the week. If the bears can get a close below the open, the week would have a bear body. That would make it a weaker buy signal bar for next week.
Overnight Emini Globex trading
The Emini is down 7 points in the Globex market. If it gaps below yesterday’s low, yesterday will be a 1 day island top. Wednesday was a 1 day island bottom, and last week’s gap down created a 3 day island top. This confirms the point that I often make that islands tops and bottoms are usually not major reversal patterns.
Today is Friday so weekly support and resistance are important. If the Emini is within about 5 points of a weekly magnet in the final hour today, it might get drawn to that magnet.
The bulls want the week to be a bull reversal bar on the weekly chart. They therefore will try to make today close above the 2837.00 open of the week. They would prefer the week to close on its high.
The bears always want the opposite and therefore want the week to close below its open. Furthermore, last week was a sell signal bar on the weekly chart. The sell triggered this week. The bears want this week to close below last week’s 2826.00 low. That would increase the chance of another week or two of sideways to down trading. If the bears get that, they will hope for the start of a swing down on the weekly chart.
Yesterday’s setups
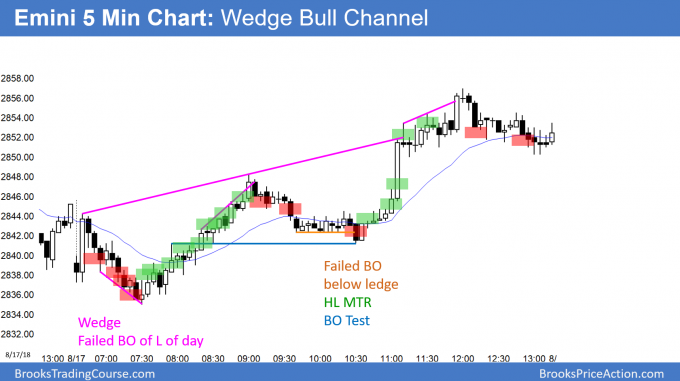
Here are several reasonable stop entry setups from yesterday. I sometimes also show limit order entries and entries on the close of bars. My goal with these charts is to present an Always In perspective. If a trader was trying to be Always In or nearly Always In a position all day, and he was not in a position at the moment, these entries would be logical times for him to enter.
EURUSD Forex small bear flag after parabolic wedge sell climax
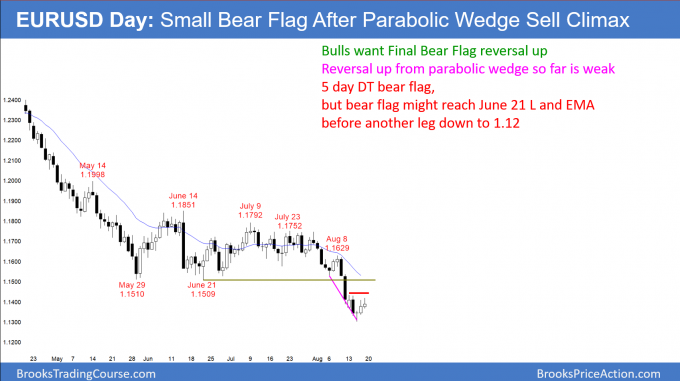
The EURUSD daily Forex chart has rallied for 3 days after a parabolic wedge sell climax. The bears have a small double top bear flag, but the bear flag might continue up to the June low and the EMA before the bears sell again. This is probably a minor reversal up.
The EURUSD daily Forex chart broke far below a 3 month trading range in a bear trend. The bulls want that trading range to be the Final Bear Flag. They are trying to create a trend reversal up.
However, the buy signal bar from 2 days ago was small and weak. In addition, the rally so far is also weak. Also, the momentum down has been strong and there is a measured move target at 1.12. This reversal therefore more likely will be a bear flag. Traders are deciding on the size of the bear flag.
It might end today or Monday and be a double top with the bull bar of 5 days ago. Alternatively, the bear rally could continue up for a week or two and reach the June low. That is the bottom of the 3 month bear flag. It is also at the 1.15 Big Round Number and the 20 day EMA.
In either case, the odds still favor a test of the 1.12 measured move target and a stronger bottom. Therefore, traders will sell this rally. In addition, the bulls will only scalp on the daily chart until there is a credible trend reversal up.
Overnight EURUSD Forex trading
The EURUSD 5 minute Forex chart has been in a 40 pip range overnight. It reversed down from a test of the high from 5 days ago. Since it has been in a trading range for 5 days, the odds favor more trading range trading today.
The most important price today is 1.1374. That is the open of the week. Today is Friday, and today’s close determines the appearance of the weekly chart. If today closes above this week’s open, the candlestick on the weekly chart will be a bull trend reversal bar. The bull body would increase the chance of higher prices next week. This is especially true if today closes at the high of the week.
The bears want a bear body on the weekly chart. They therefore will sell rallies and try to get the week to close below its open.
Since the weekly chart has 3 big bear bars, a small bull reversal bar this week is not too important. It would still probably only lead to a minor reversal up and lead to a bigger bear flag. After such a strong bear breakout on the weekly chart, the bulls will probably need a micro double bottom before they can create a bull trend. That would require another small leg down, which means at least a couple more weeks of selling after this bounce.
Summary of today’s S&P Emini futures price action and what to expect tomorrow
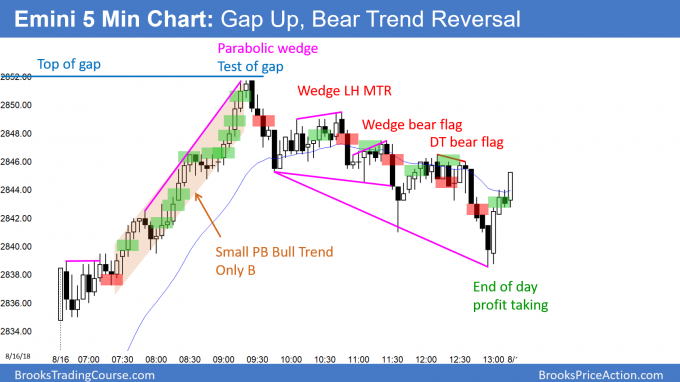
Here are several reasonable stop entry setups for today. I sometimes also show limit order entries and entries on the close of bars. My goal with these charts is to present an Always In perspective. If a trader was trying to be Always In or nearly Always In a position all day, and he was not in a position at the moment, these entries would be logical times for him to enter.
The Emini sold off on the open and reversed up from the 60 minute EMA, the open of the week, and the gap below yesterday’s low. After a higher low major trend reversal, it broke above yesterday’s high. Furthermore, it closed last week’s gap down. These all make higher prices likely.
Finally, the week closed near its high. Therefore, the candlestick on the weekly chart is a High 1 bull flag for next week. Next week will probably trade above this week’s high and trigger the buy signal. The rally might even make a new all-time high.
See the weekly update for a discussion of the price action on the weekly candlestick chart and for what to expect going into next week.
Traders can see the end of the day bar-by-bar price action report by signing up for free at BrooksPriceAction.com. I talk about the detailed S&P Emini futures price action real-time throughout the day in the BrooksPriceAction.com trading room. We offer a 2 day free trial.
When I mention time, it is USA Pacific Standard Time (the Emini day session opens at 6:30 am PST, and closes at 1:15 pm PST). You can read background information on the intraday market reports on the Intraday Market Update page.


Al,
Could you give your thoughts on the setup below. I thought it was a PERFECT High 2 signal bar on gold Futures. I was desperately trapped out of a big rally at the London open and thought this was a great entry. I bought above the bar with a stop below (as much as my risk-profile could afford). Straight away it looked bad, but I held my stop and took the loss; thank god I did because the pullback went a lot further but I was so convinced that this was great buy.
Could you explain what you’d be thinking if you saw this chart at that moment, and why the signal bar & setup didn’t work. It looked perfect.
FYI I deemed the the 2am (09pm EST) high to be insignificant, as the Asian S/R is usually not respected. Maybe that was my mistake? There was US Session price action to the left but no significant highs or lows.
Times are British Summer Time. FYI…. Forex,Dax, FTSE and all major European indices open at 8am on that chart; its when trading volume starts for the day in Europe so important time for European Markets. Maybe it was an opening reversal?
Would appreciate your thoughts on this.
https://1drv.ms/f/s!Ajlj7dTld4OYgoBSoKdXLy1saaik4Q
I believe you bought the High 2 at the EMA on the 5 minute chart at 7:05 pm PST. It was a cup and handle buy setup (pullback from a strong reversal). You then got caught in an endless pullback, which ultimately reversed up from a higher low.
The 5:50 pm EST strong breakout was likely to have a 2nd leg up, and it did. I don’t have time to go through everything, but that 2nd leg was an exhaustive buy climax and a wedge top. The odds were that there would be 2 legs down. That move to the EMA had 2 legs in a tight bear channel, and it was therefore more likely the 1st of 2 larger legs. In addition, the buy signal bar was only a doji.
After going sideways for several hours, it had its 2nd leg down. The bulls who were long and able to use the wide stop bought more at 11:15 pm PST or above 12:15 am PST and got their 2nd leg up.
If a trader bought that EMA pullback, he was expecting a bull trend. Once the bulls twice tried and failed, a trader who could not risk to below the 5:20 pm PST buy climax low would have exited because of a double top lower high at 8:25 pm PST or 9:50 pm PST. Alternatively, he would hold with a stop below the 5:20 PM PST buy climax low and scale in at the higher low.
It looks like a broad bull channel or sort of a trading range. Your attempt to buy at the top of a trading range could have been the issue (if you were buying around 930) your stop should not have been so close as you could expect 2 legs down as Al mentioned. Ideal stop should have been at 1180 and you should scale in lower if there were 2 legs down. Alternative entry would have been above 1186 with your stop where it is at