Emini triggered monthly buy signal on breakout above April high
I will update again at the end of the day
Pre-Open market analysis
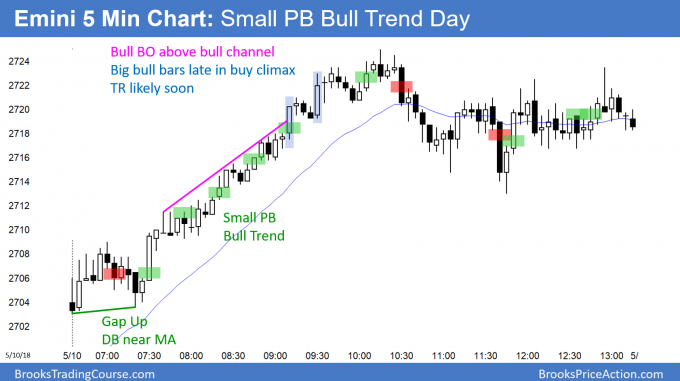
The Emini rallied strongly yesterday and traded above the April high. This triggered a buy signal on the monthly chart. However, after 3 days in a bull channel on the 5 minute chart, the bull trend evolved into a trading range. Traders will decide over the next few days if the breakout will be successful. The odds currently favor a continued rally up to the all-time high, even if there is a pullback for a couple of days.
Overnight Emini Globex trading
The Emini is up 5 points in the Globex market. When a market breaks above a resistance level, like the Emini did yesterday, the bulls take partial profits and the bears begin to sell. The result is usually a pause as the bulls and bears fight over a successful or failed breakout.
The Emini was in a trading range for the 2nd half of yesterday. This is a loss of momentum at the key resistance of the April high. There is therefore an increased chance of additional trading range trading today. There is only about a 30% chance of either a strong trend up or down today.
Since today is Friday, traders will pay attention to the weekly chart. The bulls will try to create a rally at the end of the day. They want the week to close above the April high, which is the high from 3 weeks ago. The bears know that the bar on the weekly chart will have a bull body. They want a selloff, especially late in day, to put a big tail on the top of bar. That would reduce the chance of a continued rally and increase the odds of a continuation of the 4 month trading range.
Yesterday’s setups
Here are several reasonable stop entry setups from yesterday. I sometimes also show limit order entries and entries on the close of bars.
EURUSD Forex sell climax bouncing to 1.2000
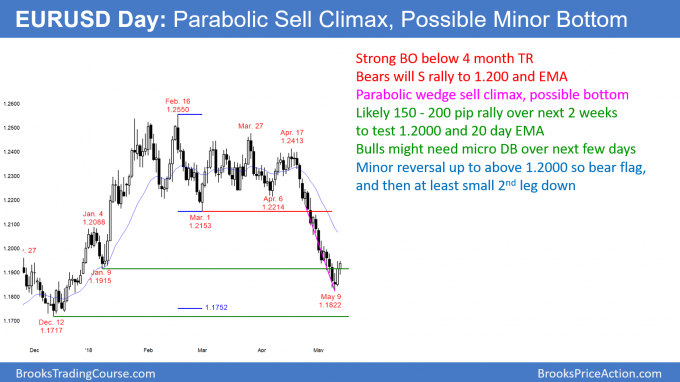
The EURUSD daily Forex chart collapsed in a series of sell climaxes. The odds favor a bounce to resistance at the 20 day EMA and the top of the most recent leg in the climax. That leg was the 4 bear bars down to the low of 2 days ago.
The EURUSD daily Forex chart is in a strong bear trend. Yet, because it has fallen in a series of strong bear legs within a tight bear channel, the selloff is climactic. That is a parabolic wedge sell climax. There is a 60% chance of a rally to the top of the most recent small leg in the climax. That is the top of the 4 final bear bars, and it will be around the 20 day EMA.
Furthermore, a bounce from a sell climax usually has at least 2 small legs and lasts about half as long as the sell climax. Since the selling took place over 4 weeks, the 150 – 200 pip sideways to up move will probably last at least a couple of weeks.
Is the bottom in? When a bear channel is tight, the bulls usually need some kind of micro double bottom before they can get their rally. Therefore, there will probably be at least a small pullback in the bear rally within a few days. That will qualify as a micro double bottom and be the start of a small 2nd leg up.
Parabolic wedge bottoms have a 30% chance of reversing into bull trends without a major trend reversal bottom. Therefore, there is a 70% chance that the rally over the next 2 weeks will either be a bear flag or a bul leg in a trading range.
In either case, there will probably be a test down to around this week’s low. Since there is important support down at the December 12 low of 1.1717 and the November 5 low of 1.1553, the odds favor lower prices over the next couple of months.
Weekly chart forming a reversal bar
The 2 day reversal has turned the candlestick on the weekly chart into a reversal bar. The market is now trading around the open of the week. If today closes above this week’s open, the weekly bar will have a bull body.
While this week’s reversal is good for the bulls, the 2 weeks before were big bear trend bars. Consequently, this week will probably not be enough for the weekly bull trend to resume. Instead, it will probably lead to a pause in the selling for a couple of weeks. The odds are that the bulls will need at least a micro double bottom on the weekly chart before the bulls can regain control.
In addition, the strong December rally begin with the 1.1717 low. The odds are that the weekly chart will have to get there over the next month or so before the bulls will have a reasonable chance of regaining control on the weekly chart.
Overnight EURUSD Forex trading
The EURUSD 5 minute Forex chart rallied about 60 pips overnight. Since this rally is either a bear flag or a bull leg in a trading range, it will probably be weak. Yet, the odds favor higher prices over the next 2 weeks. Consequently, the bulls will buy selloffs.
Furthermore, since the bears know that the daily chart is still in a bear trend, they will sell rallies. Both the bulls and bears know that a trend up or down on the daily chart is unlikely for at least 2 weeks. They will therefore will be mostly scalping for 20 – 30 pips.
The swings will soon get smaller, and day traders will then have to scalp for 10 pips. Swing trading bulls will buy dips and hold for a test of 1.2000. Swing trading bears will probably wait for a test of resistance at around 1.2000.
Summary of today’s S&P Emini futures price action and what to expect tomorrow
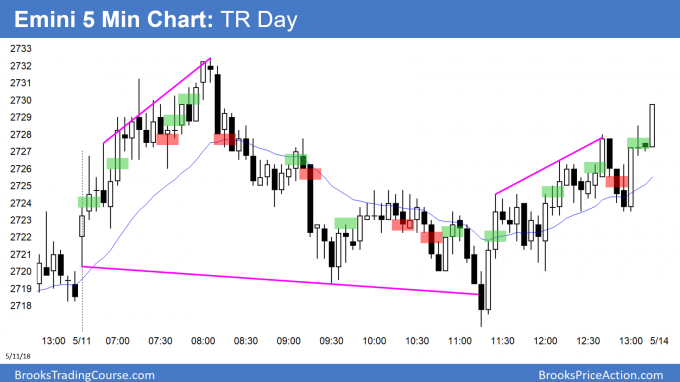
The Emini had a bear swing that reversed up at the end of the day. Today was a trading range day that closed above the open.
Today was a trading range day, but it closed near the high and above the April 18 major lower high. The odds favor a rally to a new all-time high over the next 2 months. However, if the bears get consecutive big bear bars next week, then the odds of a failed breakout become greater than those of a pullback.
See the weekly update for a discussion of the price action on the weekly candlestick chart and for what to expect going into next week.
Traders can see the end of the day bar-by-bar price action report by signing up for free at BrooksPriceAction.com. I talk about the detailed S&P Emini futures price action real-time throughout the day in the BrooksPriceAction.com trading room. We offer a 2 day free trial.
When I mention time, it is USA Pacific Standard Time (the Emini day session opens at 6:30 am PST, and closes at 1:15 pm PST). You can read background information on the intraday market reports on the Intraday Market Update page.


Al, For today was bar 7 a L2 short for a wedge (bars 2,4,7) and failed breakout above yesterday’s high with a stop above bar 7? I entered on bar 8 and stopped out on bar 9. Thank you in advance for your reply.
In the chat room, I said that it was a 2nd entry short for a failed breakout above yesterday’s high, and a wedge. The reason I said that it was not a strong sell was that the bar was only a doji and it followed 2 big bull bars. In general, I prefer higher probability trades, but that was a reasonable short.
Getting out above bar 8 made sense because the chart was still Always In Long. The bulls who exited below bar 7 would buy again above a strong bull bar, like 8. That means the bears would exit there as well.